Testimony of Jared Bernstein Before the House Financial Services Committee: Why Debt Matters
Chairman Hensarling and Ranking Member Waters, I very much appreciate the opportunity to testify before you and the committee today on this important and highly germane topic.
Key Points
There are, of course, many reasons why the debt of the federal government matters, and the following testimony briefly examines these reasons in the context of the history of debt and deficits, with an emphasis on recent decades, the current economy, and future challenges. Here, I summarize general principles that I believe should guide policy makers’ thinking about this critically important fiscal issue:
- It is common these days for some policy makers to label our debt as “unsustainable.” This is only the case if policy makers fail to undertake further steps to put the debt on a sustainable path, reinforcing the significant improvements in recent years. Those steps must involve a balanced fiscal policy that includes both new revenues and spending cuts, as well as building on recent progress in slowing the rate of growth of health costs.
- Increases in the national debt do not automatically signal a fiscal problem and in fact are necessary in special situations. Comparisons of our current fiscal situation to Greece or any other such suggestions of insolvency or excessive fiscal recklessness are ahistorical and misleading. There have been numerous times in our nation’s history — times of war and of large market failures, like the recent “Great Recession” — where temporary expansions of deficits and debt have been essential to meet the challenges we’ve faced.
- In fact, austerity measures that seek to reduce deficits and debt too quickly undermine the economy’s ability to recover from the downturn, leading to reduced job and wage growth for the vast majority of working households.
- In other words, rising debt is not by itself an obvious fiscal problem. What’s problematic is rising structural debt, meaning debt that increases (or fails to fall) as a share of the economy when a true expansion is solidly underway.
- Historically, the last time the debt was falling consistently was in the latter 1990s, when strong growth and more balanced fiscal policy contributed to low deficits, declining debt ratios, and ultimately, budget surpluses. In the 2000s, reckless fiscal policy — particularly large tax cuts — and weak growth reversed these fiscal gains. As I show below, the Bush tax cuts, most of which were made permanent in 2012, are clearly implicated as a major factor driving deficits and debt since they were enacted.
- Also in the 2000s expansion, financial excesses and underpriced risk inflated a housing bubble. Its implosion led to deep recession from which we are still recovering. The “Great Recession” required significant fiscal expansion to at least partially offset that demand contraction, yet by dint of their temporary nature, these interventions, unlike the tax cuts just noted, are not at all driving the growth of the longer-term debt.
- Since 2010, policy makers have legislated considerable fiscal consolidation and the budget deficit has fallen very quickly in historical terms. In fact, the decline in the deficit as a share of GDP from about 10% in 2009 to 4% in 2013 (fiscal years) is the largest four-year decline since 1950. As noted above, this decline has led to fiscal headwinds that have significantly slowed economic growth and hampered the expansion.
- In fact, projected 10-year deficits have decreased by $5 trillion since 2010. A bit more than $4 trillion of those deficit savings have come from legislation including the Budget Control Act, the American Taxpayer Relief Act, and related measures. Importantly, 77% of that $4 trillion in deficit savings has come from spending cuts, meaning only 23% are from higher revenues.
- Those facts have at least two important policy implications. First, the oft-cited notion that the current administration has been profligate spenders is demonstrably wrong. In fact, outlays adjusted for inflation and population growth are up 3% relative to 2008, thus including the significant anti-recessionary ramp-up in 2009, and down 12%, 2009-13. Second, future fiscal consolidation must be more balanced, with significant contributions from new revenues.
- Going forward, near term fiscal policy must support the still weak recovery. Sequestration cuts and budget proposals to severely cut programs supporting the poor and middle-class as well as key financial regulatory agencies are highly counterproductive. In this regard, the recent budget by the Obama administration offers useful measures to offset harmful discretionary cuts with balanced “payfors.”
- In the longer term, it is important to recognize that debt projections are both much improved yet still reveal the need for attention and action. Building on recent progress in slowing the growth of health costs is essential, as are balanced measures that raise new revenues while reducing costs in ways that protect economically vulnerable households. It should also be stressed that the slower growth of health costs is clearly linked to type of cost-saving measures embedded in the Affordable Care Act. To repeal these measures would do deep damage to the long term fiscal outlook.
Fiscal Policy Dynamics
The figure below — debt held by the public as a percent of GDP since 1940[1] — underscores many of the points made above.
First, a key point of my testimony is that the growth of our public debt is sometimes a very necessary response to a major national challenge. Note, for example, the spike in the debt ratio in the 1940s during WWII, a trend to which I suspect few policy makers would object. Similarly, the sharp increase in debt/GDP at the end of the figure signals the response to the Great Recession, as spending temporarily increased significantly to offset the deep, private sector contraction, while GDP fell sharply.
However, in the 1980s, we observe an increase in structural debt, i.e., an increase that occurred even while the economy recovered from the early 1980s recession, signaling a misalignment of government receipts and outlays. Next, there’s an instructive period in the 1990s when the economy achieved full employment and the debt ratio fell sharply. This period was followed by an uptick in structural debt in the 2000s (from economic trough to peak — from 2001-07 — debt as a share of GDP grew 3.7 percentage points), again a function of misaligned spending and taxes, as well as of historically weak economic and job growth in that expansion.
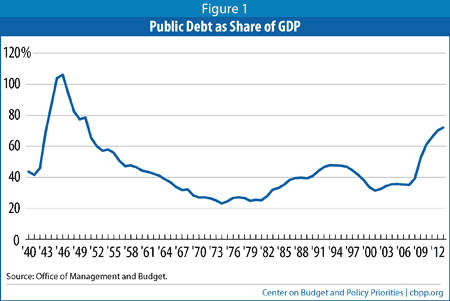
Even this cursory history shows that increases in public borrowing are often legitimate and necessary. The deficit and debt will often increase in times of war or to mitigate the suffering of Americans when, through no fault of their own, markets fail and joblessness soars. Such increases in debt should of course not be taken lightly, as they have potential consequences. For example, conditional on interest rate movements, debt service is obviously higher when the stock of public debt is larger. But neither should such increases be avoided as both the human and societal costs of budget austerity in such cases could be catastrophic. Imagine such costs if policy makers in the 1940s refused to countenance an increase in the debt required to meet the existential threat of fascism.
A second point is that structural increases in deficits and debt — increases outside of periods of recession or national emergency — such as we see in the 1980s and, to a lesser extent, the 2000s, have also occurred in recent decades. A brief examination of their origin is instructive, for it is in these cases, not the special cases like the war years or the Great Recession, wherein policy makers need to remap a fiscal course toward debt stabilization and decline.
The next figure shows both outlays and receipts as shares of GDP from 1969 through 2013. For all of this period except the latter 1990s (1998-2001), the outlay line lies above the receipt line, implying deficits. Moreover, when the budget is out of primary balance, meaning receipts are too low to cover current spending obligations other than net interest, the debt will rise (primary balance over the next decade is expected to be equivalent budget deficits of about 2.5-3% of GDP).
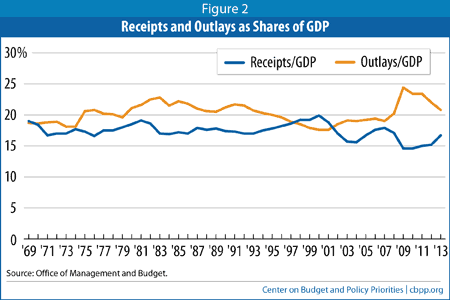
The structural deficits of the 1980s were driven by above average outlays around slightly decreased revenues. The surpluses of the late 1990s were a function of both higher revenues and lower spending as a share of the economy, which grew quickly in those years — note how the trends clearly cross late in the decade.
The Impact of Policies in the 2000s on the Fiscal Outlook
The 2000s structural deficits deserve a closer look because they were quite clearly driven by policy changes that both lifted spending, and more so, sharply reduced revenues, which fell from about 20 to around 16 percent of GDP in the first half of that decade.
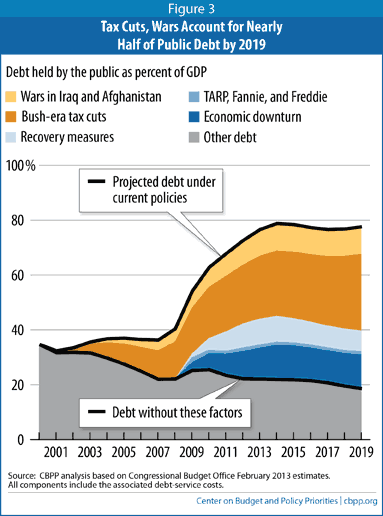
The figure below, from analysis done about one year ago by my Center on Budget and Policy Priorities colleagues Kathy Ruffing and Joel Friedman, shows the impact of various policies of the 2000s, including the Bush tax cuts, the wars, and anti-recessionary measures, on the federal debt-to-GDP ratio. The budget outlook has not changed materially since that analysis — certainly not enough to change the relative magnitudes in the figure.
By far the largest component contributing to the growth of the debt over these years is the Bush-era tax cuts, most of which — about 80 percent — were made permanent in the 2012 Taxpayer Relief Act. The recovery measures added a few percentage points to the debt ratio over the 2009-2012 period but as these measures were temporary, once they fade they do not add further to the growth of the debt. Similarly, war costs added to the debt until they peaked and then stabilized as these interventions have wound down.
As Ruffing and Friedman note:
“Some commentators blame major legislation adopted since 2008 — the stimulus bill and other recovery measures and the financial rescues — for today’s record deficits. Yet those costs pale next to other policies enacted since 2001 that have swollen the deficit and that have lasting effects.
Just two policies dating from the Bush Administration — tax cuts and the wars in Iraq and Afghanistan — accounted for over $500 billion of the deficit in 2009 and will account for nearly $6 trillion in deficits in 2009 through 2019 (including associated debt-service costs of $1.4 trillion). By 2019, we estimate that these two policies will account for almost half — over $8 trillion — of the $17 trillion in debt that will be owed under current policies. These impacts easily dwarf the stimulus and financial rescues, which will account for less than $2 trillion (just over 10 percent) of the debt at that time. Furthermore, unlike those temporary costs, these inherited policies do not fade away as the economy recovers.
…Even if we regard the economic downturn as unavoidable, we would have entered it with a much smaller debt — allowing us to absorb the recession’s damage to the budget and the cost of economic recovery measures, while keeping debt comfortably below 50 percent of GDP, as [the above figure] suggests. That would have put the nation on a much sounder footing to address the demographic challenges and the cost pressures in health care that darken the long-run fiscal outlook.”
Real Spending and Deficit Savings in Recent Years: The Results Do Not Match the Rhetoric
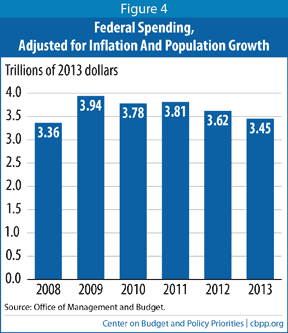
Another way to gain insight into what’s driving current debts and deficits, particularly given misguided rhetoric about the current administration’s spending contribution, is to look at the actual dollar levels of outlays over the Obama administration, adjusting for inflation and population growth. Given the rhetoric, we should surely see large and consistent increases in real outlays.
To the contrary, the figure below shows significant spending growth in one-year only: 2009, a result of fighting the deepest recession since the Depression, including automatic stabilizers and stimulus. Since then, outlays have fallen, adjusting for inflation and population growth. From 2009 to 2013, adjusted outlays are down 12%; compared to 2008, they’re up 3%, hardly the spending spree that is often suggested in partisan debates.
In fact, relative to projections that were made in the fall of 2010, new analysis by Kogan and Chen finds that spending cuts in various bills, including the Budget Control Act (2011), the American Taxpayer Relief Act (2012), the Bipartisan Budget Act (2013), and the recent farm bill generated deficit savings of $2.5 trillion over the current 10-year budget window (2015-24).[2] Adding saved interest of about $650 billion amounts to $3.2 trillion. Revenues added about $950 billion and technical and economic changes added savings of about $840 billion. Thus, Kogan and Chen find $5 trillion in savings over the budget window relative to that 2010 baseline.
Moreover, as the figure below reveals, 77% of the savings that come from policy changes (i.e., excluding technical and economic changes) are from spending cuts to government programs; less than a quarter come from revenues.
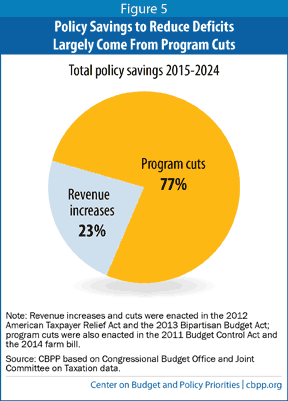
Thus, to the extent that further deficit reduction is warranted, this analysis strongly points toward new revenues as necessary to maintain a balanced approach toward achieve budget sustainability.
Optimal Fiscal Policy for the Near and Longer Terms
As I have stressed throughout this testimony, the optimal time to reduce the budget deficit is when private sector economic activity is generating enough demand to fully utilize our economic resources, including human capital. With elevated unemployment (particularly long-term unemployment), weak labor force participation, only moderate job growth, and large holdings of investment capital “on the sidelines,” the economy still needs fiscal support, not fiscal consolidation.
Extending unemployment insurance to the long-term unemployed is warranted, as the expiration of extended benefits at the end of last year occurred even though the long-term unemployment rate was significantly above its level at past expirations. A higher minimum wage would help deliver at least a bit more of the economy’s growth to low-wage workers, a group that has been uniquely left behind in both this and recent past recoveries.
Considering this committee’s jurisdiction, a number of programs that support low and middle-income families as well as the broader economy have been cut through the various budget deals noted above, including the sequestration cuts from the Budget Control Act. Moreover, recent budgets by the House majority have proposed to gut vital programs and functions that offer critical support to the very types of households left behind in this recovery.
These programs include regulatory functions of the Consumer Financial Protection Bureau, the Government Sponsored Enterprises’ support of the secondary mortgage market (and the backstop for an affordable, 30-year fixed rate mortgage), financial oversight to avoid systemic risk, housing support for veterans, the elderly, and the disabled, rental assistance for the low-income households, and neighborhood stabilization programs that remove blight while creating jobs.
The recent budget deal helped to offset some of the cuts that threaten these and other functions, but this deal expires at the end of 2015, meaning especially deep sequestration cuts would have to be made from today’s higher discretionary cap levels.
One good way to avoid these 2016 cuts would be to adopt the fiscal approach in the Obama administration’s FY2015 budget, a fiscal roadmap that embodies the balanced approach I’ve stressed throughout. While adhering to the budget agreement reached at the end of last year, the President’s budget encourages Congress to improve on that agreement and meet critical needs by increasing the discretionary caps by $56 billion, split evenly between defense and non-defense, and paid for with mandatory savings and new revenues.
The Long Term Debt Picture: Significant Improvement but Challenges Remain
Turning to the long term, the figure below reveals two important points. First, it is clear that our long-term debt picture has very significantly improved. As noted, considerable deficit savings have been legislated since 2010. Also, one of the main factors driving the long-term debt is the intersection of our aging demographics and the growth of health care costs. However, in recent years, those costs have slowed significantly, thanks in part to the types of measures introduced in the Affordable Care Act, and that too has lowered our debt projections.
This slowing of health costs appears linked to measures in the Affordable Care Act targeting more efficient delivery of health care services. Incentives to bundle care, reduce unnecessary testing, reduce hospital readmissions — basically, to emphasize quality of health care over quantity of procedures — are already yielding notable gains. Growth in real per capita health spending has been lower in recent years than in any other period dating back to the 1960s.[3] Looking ahead, CBO estimates that ACA-generated savings (not all of which are from these efficiency enhancements) will lower budget deficits by ½ percent of GDP in its second decade.[4] In this regard, any Congressional action to repeal these efficiency gains has the potential to seriously worsen the long-term fiscal outlook.
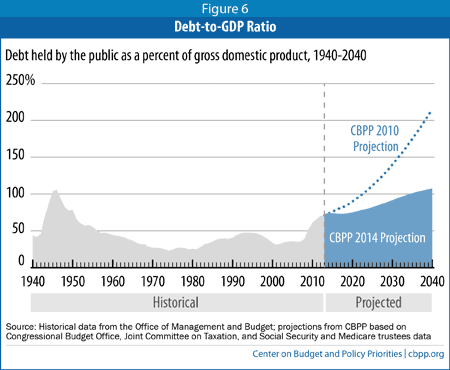
The second point of the figure, however, is that while our debt forecasts are improved, they still reveal significant pressures, with debt projected to exceed 100% of GDP before 2040. This projection strongly supports the need to continue to implement the efficiency enhancing measures in the ACA, to continue to monitor and build on the recent progress we’ve seen on health care costs, and the pursuit of balanced fiscal measures like those in the President’s new budget.
End Notes
[1] This testimony focuses on debt held by the public as opposed to gross debt. The latter includes intragovernmental debt while the former — the numerator in figure 1 — is widely agreed upon by economists, including the CBO, to be the relevant metric for both fiscal and economic analysis. See https://www.cbpp.org/cms/index.cfm?fa=view&id=3238&.
[2] https://www.cbpp.org/cms/index.cfm?fa=view&id=4106
[3] See Economic Report of the President, March 2014, Figure 4.1 http://www.whitehouse.gov/blog/2014/03/10/2014-economic-report-president
[4] http://www.cbo.gov/sites/default/files/cbofiles/attachments/43471-hr6079.pdf