Ryan Budget Would Shift Substantial Costs To States and Localities
The budget that House Budget Committee Chairman Paul Ryan developed and the full House passed recently would cause federal support for services that state and local governments provide — schools, health care, clean water facilities, and law enforcement, for example — to decline precipitously over the next several years. These reductions would be on top of deep cuts in federal funding for states and localities already scheduled under current law.
- The Ryan budget would heavily shift costs to states by cutting Medicaid funding. It would cut federal funding for the federal-state Medicaid program by 31 percent by 2023 (relative to what federal Medicaid funding for states would be under current law), and by steadily larger amounts in years after that.[1] These cuts would be in addition to the reductions in federal Medicaid funding for states that would result from the Ryan budget’s call to repeal the health reform law’s Medicaid expansion.
- The Ryan budget would further shift costs to states by imposing deep cuts in funding for a wide range of other state and local services. In addition to cutting Medicaid funding, the Ryan budget would cut non-defense discretionary (i.e. non-entitlement) funding by an average of 18 percent below the tight funding caps in the 2011 Budget Control Act (BCA) over the next ten years. About one-quarter of non-defense discretionary funding goes for grants to state and local governments to support services that states and localities provide, such as education, law enforcement, and water treatment facilities.
Such a cut would mean that states and localities would lose nearly $25.2 billion in 2014 — on top of the cuts they will absorb as Congress shrinks funding for such grants, along with other discretionary programs, to comply with the BCA caps. States and localities would lose $256 billion over the ten years from 2014 through 2023 - an 18 percent cut - in addition to the cuts they would absorb due to the BCA caps, as a result of the deep reductions the Ryan budget would make in funding for non-defense discretionary programs. (These figures do not include additional cuts that the Ryan budget would make in highway, mass transit, and other transportation spending, as explained below.)
In theory, policymakers could spare state and local funding and make all of the required cuts from purely federal areas of non-defense discretionary spending; in reality, there is no chance that would occur, as it would entail extremely deep cuts in funding for veterans’ health care, biomedical research to find cures and better treatments for various diseases, protecting the borders, the FBI, the Social Security Administration, and the like. Indeed, federal policymakers likely would cut state and local aid by more than 18 percent in order to protect funding for federal activities such as these. In particular, the Ryan budget pledges to protect veterans’ programs from its deep budget cuts. If veterans’ programs are protected, cuts to other non-defense discretionary programs — including aid to states and localities — will be even deeper, averaging 22 percent below the BCA caps through 2023, rather than 18 percent.
- Cuts in funding for state and local governments under the Ryan plan are much deeper than the automatic cuts known as “sequestration.” The BCA not only established funding caps through 2021 that will require cuts in funding for defense and non-defense discretionary programs over the next several years, but also established a mechanism that would require additional cuts through a process called “sequestration.” Those additional cuts began this month and, unless Congress reverses them, will continue through 2021.[2] The cuts under sequestration are substantial, but the cuts to non-defense discretionary funding under the Ryan budget would be nearly three times as deep in 2014. In later years, the difference would be even larger. The Ryan budget substantially lowers the BCA funding caps for non-defense discretionary programs and extends them through 2023. And because Chairman Ryan reduces his non-defense discretionary caps in nominal terms after 2021, his cuts in non-defense discretionary programs are deepest in 2023.
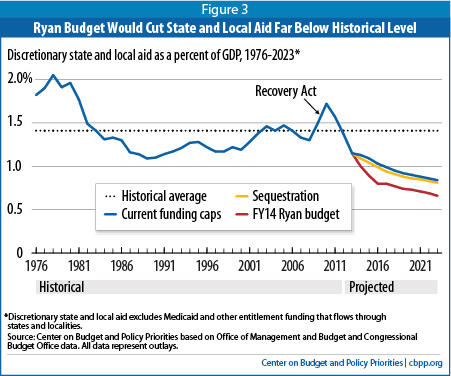
- The Ryan budget cuts likely would bring federal funding for state and local services far below historical levels. By 2023, the Ryan budget would reduce discretionary state and local grants to an estimated 0.7 percent of GDP, half the average of the last 35 years.
Cuts of such magnitude would force states and localities to reduce the quality and reach of their public services, or to raise new revenue to continue meeting these needs. Either way, the result would be a very large cost shift from the federal government to states and localities.
Ryan Budget’s Cuts to Medicaid Would Shift Heavy Costs to States
The Ryan budget would deeply cut funding for Medicaid ¾ the federal-state public insurance program that provides health coverage to nearly 65 million low-income Americans, including children, parents, seniors, and people with disabilities. It achieves its Medicaid cuts by radically restructuring the program into a block grant. Under this plan, the federal government would no longer pay a fixed share of states’ Medicaid costs. Instead, states would get a fixed dollar amount that would rise annually only with inflation and population growth. The Ryan budget also would repeal health reform’s Medicaid expansion.
- Block granting Medicaid would result in a massive funding cut for states. The block grant would cut federal Medicaid spending by $810 billion over the next ten years, from 2014-2023, according to Chairman Ryan’s budget plan. (A small share of these cuts could come from the Children’s Health Insurance Program (CHIP), which the Ryan budget would merge into its new Medicaid block grant.) This would be an estimated cut to federal Medicaid and CHIP funding of about 21 percent over ten years relative to current law and comes on top of the loss of the significant additional funding that states are slated to receive under the Affordable Care Act to expand Medicaid coverage, and to extend their CHIP programs through 2015.
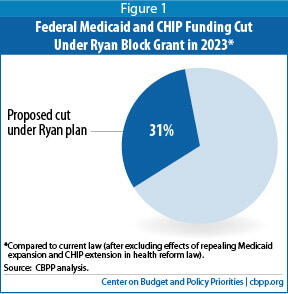
- Block grant funding levels would fall further behind state needs each year. Over the coming decade, the annual increase in the block grant amounts would average about three percentage points less per year than Medicaid’s currently projected growth rate, which accounts for factors like rising health care costs and an aging population. By 2023, federal Medicaid and CHIP spending would be $150 billion — or 31 percent — less than what states would receive under current law, according to the Ryan budget. (See Figure 1.) The cuts would continue to grow after 2023.
- In some years, the loss of federal funding would be even greater. The federal funding cuts would be even higher in years when enrollment or per-beneficiary health care costs rose faster than expected, such as during a recession or after the introduction of new, breakthrough health-care technology or treatments that improve patients’ health and may save lives but increase cost. Currently, the federal government and the states share in those unanticipated costs; under the Ryan plan, states alone would pay them.
As the Congressional Budget Office concluded when it analyzed the similar Medicaid block grant proposal from last year’s Ryan budget plan, “the magnitude of the reduction in spending . . . means that states would need to increase their spending on these programs, make considerable cutbacks in them, or both.”[3] Because Medicaid is already lean — it costs much less per beneficiary than private insurance does — and states already exercise considerable flexibility, claims that states could somehow manage large federal funding cuts simply by providing Medicaid coverage more efficiently are highly unrealistic.
Deep Cuts to Discretionary Funding Would Shift Further Costs to States and Localities
In addition to shifting substantial costs to states by cutting federal Medicaid funding, the Ryan budget would sharply reduce funding for the non-defense discretionary part of the federal budget, a quarter of which goes to provide resources to states and localities to provide a wide range of other public services (detailed below).
Over the ten years from 2014 through 2023, the Ryan plan would cut non-defense discretionary funding by nearly $1.1 trillion ? 18 percent ? below the already severe annual budget caps that the Budget Control Act (BCA) imposes on these programs. In 2014 alone, the Ryan budget would cut funding for these programs by an additional 20 percent beyond the cuts already needed to comply with the BCA caps.
If grants to state and local governments were cut in 2014 by the same 20 percent that non-defense discretionary funding as a whole would be reduced, then states and localities would lose nearly $25.2 billion that year alone. Over the ten years through 2023, states and localities would absorb a cumulative federal funding cut of $256 billion, assuming state and local grants were cut by the same 18 percent that non-defense discretionary funding is reduced over this longer period. (These figures exclude additional cuts to federal funding for road building and other transportation projects that require a different methodology to calculate; see the appendix for state-by-state estimates.)
In theory, the appropriations process could spare funds for states and localities by making most or all of the required cuts from purely federal areas of non-defense discretionary spending. A more likely scenario, however, is that programs providing funding to state and localities would receive at least their proportionate share of these cuts and perhaps more. If Congress chooses largely to protect funding for federal functions such as the FBI, border enforcement, medical research, veterans’ health care, and food safety (all of which are part of non-defense discretionary funding), then federal funding for programs administered at the state and local level would face cuts significantly deeper than 18 percent over the next decade.
Ryan Budget Cuts Much Deeper Than Sequestration
The Budget Control Act established annual funding caps that will necessitate significant reductions in both non-defense and defense discretionary spending over the next several years. The BCA also required a further round of cuts known as “sequestration” that began this month and are scheduled to continue for nine years.[4] If the sequestration cuts remain in place, they would force substantial further cuts in federal funding for states and localities.
State Budgets Continue to Struggle; More Cuts Would Further Slow Economic Recovery
The Ryan budget’s deep cuts in funding to states and local governments to carry out various functions would come at a time when states and localities already are hobbled by the recession and sluggish recovery. Further cuts would make it even harder for states and localities to repair the budgetary damage carried by the recession and would ensure that state and local cuts continue to be a drag on the national economy’s recovery.
The Great Recession that started in 2007 caused the largest collapse in state revenues on record. Since bottoming out in 2010, revenues have begun to grow again but are still far from fully recovered. As of the third quarter of 2012, state revenues remained 5.7 percent below pre-recession levels, adjusted for inflation, and they are not growing fast enough to recover fully any time soon.
Meanwhile, states’ education and health care obligations continue to grow. States expect to educate 540,000 more K-12 students and 2.5 million more public college and university students in the current school year than in 2007-08.a In addition, 3.9 million more people were projected to be eligible for subsidized health insurance through Medicaid in 2012 than were enrolled in 2008, as some employers have dropped their coverage and people have lost jobs and wages.b
States have been forced to close enormous budget shortfalls totaling nearly $600 billion since the 2009 fiscal year.c The actions that states have taken to close these budget gaps, primarily spending cuts, have imposed a significant drag on the economic recovery. Since the recession took hold in August 2008, state and local governments have shed 753,000 jobs.
Deep additional federal cuts in funding to state and local governments would cause further damage to their budgets, reducing the number of jobs that states and localities produce and holding back the country’s efforts to recover more fully and expeditiously from the recession.
a U.S. Department of Education, “Condition of Education 2012,” tables A-3-1, A-10-1, and A-11-1,http://nces.ed.gov/pubsearch/pubsinfo.asp?pubid=2012045.
b CBPP calculations based on data from the Congressional Budget Office and Centers for Medicare and Medicaid Services.
c Phil Oliff, Chris Mai, and Vincent Palacios, “States Continue to Feel Recession’s Impact,” Center on Budget and Policy Priorities, updated June 27, 2012, https://www.cbpp.org/cms/index.cfm?fa=view&id=711.
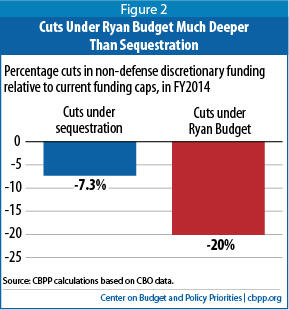
Broadly speaking, sequestration will cut about 7.3 percent, on average, from affected non-defense discretionary programs for 2014, including most discretionary grants to states and localities (a major exception is transportation programs, which are not included under the BCA caps or subject to sequestration; see below). In subsequent years, the percentage cut under sequestration (relative to the funding levels under the BCA caps) will decline gradually. In 2015, it will be about 7.1 percent; by 2021 it will be about 5.5 percent.
Those cuts are substantial, but the Ryan budget would cut non-defense discretionary programs much more deeply — by 20 percent below the BCA caps in 2014 and by 18 percent below the BCA caps over the full 2014-2023 period.
That is, in 2014 the overall cuts in funding for non-defense discretionary programs under the Ryan budget would be almost three times as deep as the cuts scheduled under sequestration. In later years the difference is even larger. States and localities are justifiably worried about sequestration’s major federal funding cuts, but the damage from the Ryan budget would be much more severe.
Ryan Budget Would Cut Discretionary Aid Far Below Historical Levels
The Ryan budget likely would cut discretionary spending so heavily that this funding would fall far below historical levels over the coming decade.
Even the current caps on discretionary spending under the Budget Control Act would cut federal discretionary funding for states and localities significantly as a share of the economy. Assuming the cuts to state and local aid are proportional to the cuts in non-defense discretionary funding overall, they would bring federal funding to state and local governments through discretionary programs to the lowest levels in four decades, measured as a share of the economy — even without sequestration. The cuts under sequestration - if Congress allows them to go forward - would push this funding even lower.[5]
As difficult as the current spending caps will be for states and localities, the Ryan budget would impose much deeper cutbacks. Since 1976, federal discretionary grants to states and localities have averaged 1.4 percent of the nation’s Gross Domestic Product (GDP). By 2023, the Ryan budget would reduce this funding to about 0.66 percent of GDP, half the historical average and well below the level likely to be provided under the BCA caps. (In 2023, under the BCA caps, discretionary funding to states and localities would likely be about 0.84 percent of GDP.)
Ryan Budget Would Weaken States’ Capacity to Provide High-Priority Services
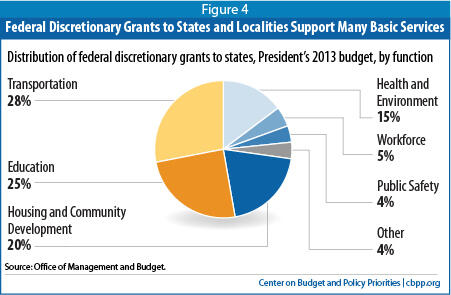
Federal discretionary grants to states and localities finance a number of national priorities. More than a quarter of federal discretionary aid for states and localities supports transportation projects — mainly road and bridge construction, planning, and repair (see below for information on how the Ryan budget reduces federal support for these projects). Another quarter goes to education. Thus, more than half of federal discretionary grants to states help pay for education or transportation projects — two functions of state and local governments that are basic building blocks of the economy.
The remainder of federal discretionary grant funding helps states and localities undertake a wide range of other important functions, including protecting waterways from sewage contamination, protecting public safety, reducing homelessness, revitalizing run-down neighborhoods, and providing technical job skills training to community college students and others.
To be sure, states and localities bear a heavy responsibility themselves to finance these areas of spending, and even after years of state and local budget cuts, state and local taxes still provide the lion’s share of the funding for most of these services. But state and local tax revenue remains depressed by the recession and is unlikely to fully recover soon, much less to grow anywhere near fast enough to make up for substantial new federal cutbacks.
Cutting this funding deeply — as would likely occur under the Ryan budget — would force states and localities to lay off people who perform these functions and to cut spending in these areas in other ways, or to raise substantial new revenue to continue addressing these needs. Either way, the result would be a large cost shift from the federal government to states and localities.
Transportation
Over a quarter (28 percent) of federal discretionary grants to states helps build and improve roads and other transportation systems. These projects are crucial to the nation’s economic health, because businesses require efficient transportation systems to get their products to market in a timely way, and workers use these systems to commute to their jobs. Cutting federal support for these projects would shift costs to states and localities, which would have to choose between raising more revenue or reducing their transportation investments and absorbing the indirect cost to their economies and quality of life.
Major transportation initiatives threatened with severe cuts under the Ryan budget include:
- Road and bridge planning, construction, and rehabilitation. Some 73 percent of federal aid for state transportation programs goes to help states plan, build, and make major repairs to their roads and bridges. These programs help assure that the National Highway System, which carries about 85 percent of the vehicle miles driven nationally each year, continues to transport goods and people efficiently as the economy grows over time.[6]
- Public transit. Federal grants for public transit have provided an average of $8 billion a year over the last decade to help plan, upgrade, and (in small urban areas) operate bus and rail transit systems and other forms of public transportation. Other programs help people who have disabilities or are elderly to access public transit, promote job access for low-income commuters, and develop pathways for cyclists and pedestrians.
- Airports. In 2011, these funds financed nearly 2,000 projects at airports around the country to improve runways and to accommodate growth in flights, passengers, and the size of aircraft.[8]
Ryan Budget Axe Wouldn't Spare Transportation Aid
The Ryan budget would impose substantial cuts to highways and other transportation aid for states and localities. These cuts would come on top of the large cuts to other forms of state and local funding discussed in this paper.
Unlike other discretionary grant funding, most funding for state and local transportation projects such as building highways and new airport runways is not affected by the spending caps imposed last year under the Budget Control Act (this funding is outside the caps), and is exempt from sequestration. For those reasons, estimating how much states and localities would lose in transportation funding requires a different methodology than other forms of discretionary funds for which the BCA spending caps provide an appropriate baseline.
In 2014, the Ryan budget would reduce discretionary aid to states and localities for transportation projects by about 8 percent — about $5 billion — relative to 2013 levels adjusted for inflation.a Over the next ten years, the Ryan budget would require about $139 billion in cumulative cuts to state and local transportation aid, relative to current levels adjusted for inflation. That’s a cut of 23 percent over the full ten-year period.
These cuts would come on top of the Ryan budget’s cuts to other forms of discretionary grants, which total $256 billion through 2023, relative to the current BCA spending caps.
a See methodological appendix for a description of how these estimates were developed.
Education
Another quarter of the value of federal discretionary grants goes to help states educate children. These funds mostly end up with elementary and high schools, primarily to help them educate children from low-income families and children with learning disorders and other types of disabilities. The funds also go to agencies that provide preschool education to low-income children through the Head Start program and to school districts to help them train better teachers and reduce class sizes.
If these federal grants are reduced sharply, as they would be under the Ryan budget, states and local governments will be forced to choose between increasing their own spending to protect their schools or allowing their schools to take the financial hit, which could damage the quality of their education systems.
Cutting this funding would hurt high-poverty schools the most, because the federal aid is targeted disproportionately to those schools. That could undermine education reform efforts in many states and deepen already disturbing inequities in the educations received by children from families of varying income levels. Heavy cuts to Head Start would deepen these problems further by reducing many thousands of low-income children’s preparedness for kindergarten.
The cuts likely also would cause school districts to lay off more teachers and other education workers, weakening the economy’s sluggish recovery. (School districts have already cut 333,000 teaching and other education jobs since August 2008, even as school enrollment has continued to grow.) And by diminishing the quality of the education that many of the nation’s children receive, deep cuts to education funding — on top of those already imposed by states since the start of the recession — could also adversely affect the nation’s long-term economic prospects, as children who receive an inadequate education are less likely to become highly productive adults.
Major education programs threatened with deep cuts under the Ryan budget include:
- High-poverty schools (Title I). Title I provides financial assistance to schools with high numbers or percentages of children from low-income families, to help these children meet state academic standards. Some 56,000 schools nationally received this funding in 2009, helping them educate 21 million children that year.[9]
- Special education (IDEA). Funding through the Individuals with Disabilities Education Act provides federal support to schools to help them educate children with learning disorders, speech impairments, and other disabilities. Some 6.5 million children nationally received specialized learning assistance through this funding in 2010.[10]
- Pre-school programs provided through Head Start. Head Start promotes school readiness among at-risk children up to age 5 by enhancing social and cognitive development through education, health, nutritional, and other services and by engaging families in children’s learning. Early Head Start serves children from birth to age 3 and some pregnant women. Together, these programs served 1,142,000 children nationally in 2011.[11]
- Improving teacher quality. The U.S. Department of Education provides grants to states and school districts to improve the quality of teaching in their schools. School districts with the highest poverty levels receive a disproportionately large share of the funds. Most of the grant money is spent on training programs to help teachers be more effective and to reduce class sizes by employing more teachers. School districts used this funding to pay the salaries of more than 14,000 teachers nationally to reduce class sizes in the 2011-12 school year.[12]
- Impact aid. These funds provide support to school districts near military bases, Indian lands, or other types of property that cannot be taxed by the school district. In 2010, over 12 million students attended schools that received this aid.[13] Nearly 40 percent of them were children from military families.[14]
Housing and Community Development
Another 20 percent of discretionary grant funding to states and local entities goes to housing and community development programs. Most of this funding is used to help low-income renter families pay their rent. The biggest program in this category, known as “Section 8,” is really two programs, one of which provides low-income renters with vouchers they can use to help them afford the rent on modest apartments, and the second of which directly funds private property owners to offer units to low-income people at affordable rental charges. The category also includes funding for energy assistance payments that help low-income people pay their heating and cooling bills; community development programs that — among other things — revitalize blighted neighborhoods and build public infrastructure such as sewer systems and recreation centers; and public housing.
Large cuts to the funding for these programs would shift substantial costs to states and localities. Such cuts would make housing and utility bills significantly less affordable to a large number of low-income people, likely increasing the number of homeless individuals and families. This would increase the need for shelter space, which is significantly more expensive per unit than rent subsidies. Because community development funds are often used to revitalize run-down areas, cutting them sharply could cause some property values to slip and blight to increase, especially in lower-income neighborhoods and other areas nearby. Lower property values also would diminish the revenue available for local governments to fund schools and other fundamental local public services. Increased blight could also increase other costs for cities and other localities, for example by adding to demands on building inspectors, housing agencies, and police departments.
The major housing and community development programs threatened with large cuts under the Ryan budget include:
- Rental assistance for low-income people. The Housing Choice Voucher program, the principal component of “Section 8,” provides vouchers that nearly 2.1 million low-income families use to defray part of the rent on a modest apartment or other home in the private retail market. Roughly half of the low-income households benefiting are headed by seniors or people with disabilities; most of the rest are families with children.[15] The other “Section 8” program, the Project-Based Rental Assistance program, provides rental assistance payments to private owners of 1.2 million units of affordable housing. Two-thirds of the residents of these housing units are low-income seniors or people with disabilities.
Assistance for paying heating or cooling bills (through the Low Income Home Energy Assistance Program, or LIHEAP). Many impoverished people receive help paying their home energy bills through this program. In 2008, 6.9 million people nationally received this assistance.[17]
- Community Development Block Grants. States, cities, and counties use this funding to revitalize deteriorating neighborhoods, improve water and sewer systems, and build community centers, youth centers and libraries, and a range of other public infrastructure projects.[18]
- Public Housing.Public housing provides affordable homes to 2.2 million of the nation’s poorest residents. More than half of these households are headed by seniors or people with disabilities.[19]
Health and Environment
Some 15 percent of discretionary aid to states and localities funds states to provide nutrition to low-income newborns and expecting mothers, protect waterways from sewage contamination, prevent and treat addictions, provide health care to people with limited access to it, and provide other protections of the public’s health or the environment.
Deep cuts to this funding would force states and localities to choose between using more of their own funds to sustain these efforts and allowing the programs to diminish. If states and localities replaced the lost funds with their own revenues, the cost shift would be direct.
Providing fewer new low-income mothers and their very young children with nutritional food could lead to more children with health problems, which would increase state Medicaid costs, among other near-term impacts, and could affect the state’s long-term economic potential by reducing the productivity of the future workforce. Similarly, completing fewer clean water projects could lead to public health problems deriving from contaminated rivers and lakes and diminish the value of those waterways for recreational purposes, reducing the local quality of life and the area’s attractiveness to tourists and investors. Providing help to fewer people with mental illnesses or addictions could mean police officers will confront more people with untreated mental health or addiction problems, adding to their costs, among other indirect costs to states and localities.
Major health and environment programs threatened with large cuts under the Ryan budget include:
- Nutrition support for new and expecting mothers, and for their young children (WIC). The Special Supplemental Nutrition Program for Women, Infants, and Children provides nutritious food and nutritional education (including breastfeeding education and support) to new and expecting low-income mothers, including those with children under age 5. In an average month in 2012, the program — delivered by thousands of agencies and health clinics across the country — served over 2 million low-income women and nearly 7 million infants and children.[20]
- Clean Water State Revolving Fund. Every state operates a revolving loan program — paid for mostly with federal money — that funds wastewater treatment projects, sewer projects, and other infrastructure that protects and restores the health of rivers, lakes, and estuaries. In 2009, these funds allowed for agreements to support nearly 2,000 clean water projects and over $5 billion in loans.[21]
- Mental health and substance abuse services. These grants help states prevent and treat alcohol and drug abuse and provide community mental health services to adults and children with serious mental illness. In 2008, over two million individuals attended substance abuse facilities that received federal funding; over six million received federally supported mental health services.[22]
- Community Health Centers. These non-profit facilities provide primary-care medical services to people with limited access to health care. In 2011, more than 8,500 centers nationally provided medical care to over 20 million patients, many of them poor.[23]
Workforce
Another 5 percent of federal discretionary funding provided to states and localities goes to help state and local governments train, protect, and build a stronger workforce. People who are unemployed often need training and help finding new employment. Low-income people often need help affording child care so they can go to work. High school and community college students often benefit from classes that teach job skills. And people who lack basic reading and language skills often need basic education classes to help them find employment and succeed on the job. These sorts of human capital investment can improve the quality of the state and local workforce, helping employers find productive workers and boosting the economy. Sharp reductions in the federal funds that help pay for these programs would shift costs to states and localities, forcing them to either pick up the costs themselves or absorb the damage to the quality of their workforce if the cuts take effect.
Workforce programs that are threatened with large cuts under the Ryan budget include:
- Training and Employment Services.State and local governments receive these grantsto provide job search and placement assistance, occupational training, and career counseling to unemployed adult workers and to low-income youth who need help building their skills.[24]
- Child care subsidies for low-income working parents. These funds subsidize child care for low-income parents so they can find and keep a job. In 2010, the subsidies helped 1 million parents find child care.[25]
- Adult and vocational education. Adult education classes help people get the basic skills they need to be productive as workers (and in their families and communities); for example, these classes help people learn to read, do basic math, speak English, or earn a general equivalency diploma. In 2009, 2.4 million people participated in classes to learn these sorts of basic skills.[26] Vocational education funds pay for technical and vocational education for high school and community college students, giving them skills they can carry into the workforce.
- Unemployment Insurance administration. These funds help finance the administration of state unemployment insurance programs.
Public Safety
Federal discretionary funds also help states, cities, and other local governments hire, train, and equip police officers. Big cuts in these funds would shift more of the cost of hiring and preparing these officers to state and local budgets.
Public safety programs that are threatened with large cuts under the Ryan budget include:
- Justice Assistance Grants (JAG). Most of these grants go to help local law enforcement agencies train police officers, supply them with police cars, bulletproof vests, and other equipment, and cover overtime. The rest help states and localities operate other aspects of their criminal justice systems, including prosecuting criminals, taking other actions to reduce crime, and protecting victims and witnesses.[27]
- Funds to hire state & local police officers (COPS). These funds help state and local law enforcement agencies hire police officers. In 2012, these grants helped to fund or maintain more than 800 law enforcement positions nationally.[28]
Methodological Appendix
Concepts: Our approach requires us to examine both budget authority and outlays for non-defense discretionary grants to states and localities. For discretionary programs, budget authority refers to the funding level determined by the annual appropriations process. Outlays refer to the actual spending that results from budget authority. Because budget authority provided in a single year may be spent over that and several subsequent years, changes in outlays tend to lag behind changes in budget authority. Generally, budget authority is the best benchmark for comparison between different discretionary funding proposals, since it avoids the lag that occurs with outlays.
Funding for most transportation grants, however, is not counted as discretionary budget authority. [29] Therefore, we evaluate the impact of the Ryan budget on outlays for discretionary transportation grants and on budget authority for all other non-defense discretionary grants. Since, as explained below, sequestration does not apply to most transportation grants, we only look at the impact of sequestration on other non-defense discretionary grants.
Baseline Assumptions: To determine how sequestration or the Ryan budget would affect grants to states and localities, we need to construct a baseline from which to measure those cuts. We began this analysis with a set of baseline assumptions to project how much funding will be allocated to federal grants to states and localities from 2014-2023 under current policies. We assume that under current policy, lawmakers will adhere to the annual caps on aggregate non-defense discretionary budget authority set in the Budget Control Act of 2011 (BCA). (The BCA also established caps on defense discretionary funding, but only an occasional, miniscule amount of defense funding is distributed in the form of grants to state and local governments. This report does not address those grants.) These non-defense caps (and the defense caps) remained flat in nominal terms from 2012 to 2013, and grow roughly with inflation from 2013 through 2021; we assume, like the Congressional Budget Office (CBO), that non-defense discretionary funding continues to grow roughly with inflation through 2023.
In constructing our baseline, we assume that funding for discretionary grants to states and localities other than transportation grants will grow at the rate of growth of the BCA caps on aggregate non-defense discretionary budget authority from 2012 through 2021 and with the CBO baseline (excluding sequestration) from 2021 through 2023, using the enacted level of funding for 2012 as our base. That is, we assume that such grants will represent the same share of total non-defense discretionary funding in 2013 through 2023 as they did in 2012.
Most transportation grants are not subject to the caps on non-defense discretionary budget authority because the funding for most transportation grants is not counted as discretionary budget authority. The expenditures that eventually flow from the funding are, however, classified as discretionary outlays. Our baseline for those outlays is the same as the Congressional Budget Office’s baseline projection of spending for those programs, which assumes the current (2013) level of available funding will grow with inflation, with a few adjustments to reflect current policies. We assume that transportation grants that receive discretionary budget authority grow with the BCA caps, and, like the Ryan budget, we remove outlays resulting from emergency funding for Hurricane Sandy relief after 2013. (We make the same baseline assumptions for the discretionary transportation budget function 400, which comprises transportation grants and other federal programs.)
Methods: We estimated the cuts in grants to state and local governments due to sequestration and the Ryan budget by, in each case, applying in each year a percentage cut applicable to discretionary transportation grants and a percentage cut applicable to all other non-defense discretionary grants. We assume these percentage cuts apply across the board to all transportation grants and across the board to all other non-defense grants, respectively. And we assume that the percentage cuts to grants within the transportation category or within the other non-defense category would be the same as the percentage cut (if any — as noted, sequestration does not apply to programs funded through the transportation trust funds) required in the overall level of funding for each such budget category by sequestration or by the Ryan budget.
The cuts in funding for non-defense discretionary programs other than transportation required by the BCA sequestration are based on the requirements of that law and our estimates of its impacts, which are detailed in a Center analysis issued in February 2013.[30]
The Ryan budget would cut both transportation discretionary grants and other non-defense discretionary grants. For non-transportation grants, we assume they would be cut in proportion to Ryan’s total cuts to non-defense discretionary funding, which are about 20 percent below current the BCA cap level in 2014, and average 18 percent below the BCA cap levels through 2023. We assume transportation grants to states and localities would be cut in proportion to Ryan’s total cuts to discretionary transportation outlays. We determine Ryan’s cuts to discretionary transportation outlays by taking the Ryan budget’s total cuts in discretionary outlays in the transportation budget function 400, plus a proportional share of the plan’s proposed cuts in discretionary outlays that were not attributed to any budget function. (From 2014-2023, the Ryan budget contains cuts of nearly $900 billion in non-defense discretionary funding and over $700 billion in non-defense discretionary outlays that are left unspecified — that is, that are not attributed to any programmatic budget function.[31] To reflect the impact of the Ryan proposal on various programs, we distribute these cuts proportionally among all of the non-defense discretionary budget functions, including transportation.)
We estimated a state-by-state distribution of the cuts in non-transportation discretionary grants under the Ryan budget based on the distribution of such grants in recent years. (We excluded cuts to transportation funding from these state-by-state estimates because we estimated the size of the cuts relative to the BCA spending caps, and transportation is largely exempted from these caps, as explained above.) We used the Census’ Federal Aid to States to determine each state’s average share of non-defense, non-transportation discretionary grants for 2006-2010, excluding grants for 2009 due to the unusual impact of the American Reinvestment and Recovery Act on funding for that year.
| Table 1 Ryan Budget Would Cause Deep Cuts in Discretionary State and Local Aid in 2014 | ||
| Total Discretionary Grants to States Localities in 2014 Under Current Funding Caps* (in millions) | Estimated Cuts of 20.1 Percent to These Grants in 2014 Under Ryan Budget (in millions) | |
| United States | $ 125,586 | -$25,218 |
| Alabama | 1,788 | -359 |
| Alaska | 805 | -162 |
| Arizona | 2,075 | -417 |
| Arkansas | 1,059 | -213 |
| California | 13,551 | -2,721 |
| Colorado | 1,664 | -334 |
| Connecticut | 1,576 | -317 |
| Delaware | 394 | -79 |
| District of Columbia | 2,793 | -561 |
| Florida | 5,933 | -1,191 |
| Georgia | 2,560 | -514 |
| Hawaii | 642 | -129 |
| Idaho | 586 | -118 |
| Illinois | 5,182 | -1,041 |
| Indiana | 1,860 | -373 |
| Iowa | 1,077 | -216 |
| Kansas | 1,027 | -206 |
| Kentucky | 1,499 | -301 |
| Louisiana | 4,627 | -929 |
| Maine | 683 | -137 |
| Maryland | 2,337 | -469 |
| Massachusetts | 3,259 | -654 |
| Michigan | 3,792 | -761 |
| Minnesota | 1,912 | -384 |
| Mississippi | 2,633 | -529 |
| Missouri | 1,740 | -349 |
| Montana | 648 | -130 |
| Nebraska | 690 | -139 |
| Nevada | 896 | -180 |
| New Hampshire | 576 | -116 |
| New Jersey | 3,444 | -692 |
| New Mexico | 1,036 | -208 |
| New York | 10,789 | -2,167 |
| North Carolina | 2,887 | -580 |
| North Dakota | 502 | -101 |
| Ohio | 3,422 | -687 |
| Oklahoma | 1,570 | -315 |
| Oregon | 1,520 | -305 |
| Pennsylvania | 4,834 | -971 |
| Rhode Island | 550 | -110 |
| South Carolina | 1,558 | -313 |
| South Dakota | 466 | -93 |
| Tennessee | 2,036 | -409 |
| Texas | 8,920 | -1,791 |
| Utah | 768 | -154 |
| Vermont | 424 | -85 |
| Virginia | 2,476 | -497 |
| Washington | 2,438 | -490 |
| West Virginia | 888 | -178 |
| Wisconsin | 1,877 | -377 |
| Wyoming | 308 | -62 |
| *Total discretionary grants in 2014 are estimated based on funding for 2012 and use the funding caps established by the Budget Control Act as a baseline. Other notes: Distribution of these grants by state is estimated based on the average distribution of discretionary grants to states in 2006–2010 (excluding 2009 due to the unusual impact of the American Reinvestment and Recovery Act). Assumes that grants to states will be reduced by a percentage equal to the projected cut in all non-defense discretionary funding under the Ryan budget. Excludes grants to states from the U.S. Department of Transportation, because estimating the future size of these grants requires a different methodology from the one used here. | ||
| Table 2 Ryan Budget Would Cause Deep Cuts in Discretionary State and Local Aid from 2014 – 2023 | ||
| Total Discretionary Grants to States & Localities from 2014 – 2023 Under Current Funding Caps* (in millions) | Estimated Cuts of 18.4 Percent to These Grants from 2014 – 2023 Under Ryan Budget (in millions) | |
| United States | $ 1,392,475 | -$ 256,110 |
| Alabama | 19,824 | -3,646 |
| Alaska | 8,929 | -1,642 |
| Arizona | 23,002 | -4,231 |
| Arkansas | 11,739 | -2,159 |
| California | 150,247 | -27,634 |
| Colorado | 18,454 | -3,394 |
| Connecticut | 17,479 | -3,215 |
| Delaware | 4,373 | -804 |
| District of Columbia | 30,968 | -5,696 |
| Florida | 65,787 | -12,100 |
| Georgia | 28,381 | -5,220 |
| Hawaii | 7,117 | -1,309 |
| Idaho | 6,500 | -1,195 |
| Illinois | 57,461 | -10,568 |
| Indiana | 20,623 | -3,793 |
| Iowa | 11,939 | -2,196 |
| Kansas | 11,389 | -2,095 |
| Kentucky | 16,623 | -3,057 |
| Louisiana | 51,304 | -9,436 |
| Maine | 7,574 | -1,393 |
| Maryland | 25,917 | -4,767 |
| Massachusetts | 36,139 | -6,647 |
| Michigan | 42,047 | -7,733 |
| Minnesota | 21,205 | -3,900 |
| Mississippi | 29,191 | -5,369 |
| Missouri | 19,288 | -3,547 |
| Montana | 7,183 | -1,321 |
| Nebraska | 7,654 | -1,408 |
| Nevada | 9,936 | -1,828 |
| New Hampshire | 6,386 | -1,175 |
| New Jersey | 38,187 | -7,024 |
| New Mexico | 11,485 | -2,112 |
| New York | 119,630 | -22,003 |
| North Carolina | 32,007 | -5,887 |
| North Dakota | 5,563 | -1,023 |
| Ohio | 37,939 | -6,978 |
| Oklahoma | 17,408 | -3,202 |
| Oregon | 16,851 | -3,099 |
| Pennsylvania | 53,595 | -9,857 |
| Rhode Island | 6,101 | -1,122 |
| South Carolina | 17,278 | -3,178 |
| South Dakota | 5,161 | -949 |
| Tennessee | 22,570 | -4,151 |
| Texas | 98,906 | -18,191 |
| Utah | 8,511 | -1,565 |
| Vermont | 4,701 | -865 |
| Virginia | 27,458 | -5,050 |
| Washington | 27,030 | -4,972 |
| West Virginia | 9,843 | -1,810 |
| Wisconsin | 20,815 | -3,828 |
| Wyoming | 3,416 | -628 |
| *Total discretionary grants in 2014-23 are estimated based on funding for 2012 and use the funding caps established by the Budget Control Act as a baseline. Other notes: Distribution of these grants by state is estimated based on the average distribution of discretionary grants to states in 2006–2010 (excluding 2009 due to the unusual impact of the American Reinvestment and Recovery Act). Assumes that grants to states will be reduced by a percentage equal to the projected cut in all non-defense discretionary funding under the Ryan budget. Excludes grants to states from the U.S. Department of Transportation because estimating the future size of these grants requires a different methodology from the one used here. | ||
End Notes
[1] A modest share of these cuts could come from the Children’s Health Insurance Program (CHIP), which the Ryan budget would merge into its new Medicaid block grant.
[2] By statute, the BCA caps and sequestration are scheduled to continue through 2021. However, the BCA caps and sequestration will continue to constrain discretionary funding thereafter, because future discretionary appropriations tend to be based on current levels. By convention, the Congressional Budget Office assumes that discretionary appropriations grow roughly with inflation from current levels in its budget projections; because total discretionary funding is already determined by law through 2021, the CBO assumes discretionary funding in years after 2021 equals the 2021 level adjusted only for inflation.
[3] Congressional Budget Office, “The Long-Term Budgetary Impact of Paths for Federal Revenues and Spending Specified by Chairman Ryan,” March 2012, http://www.cbo.gov/publication/43023.
[4] The Budget Control Act imposed caps on defense and non-defense discretionary programs that will reduce their funding by about $1.6 trillion over the ten years from 2014 through 2023, relative to funding levels in 2010 (the last budget enacted before Congress began to cut discretionary programs substantially), adjusted for inflation. Roughly three-fifths of these cuts would come from non-defense discretionary programs. The BCA also established a Joint Select Committee on Deficit Reduction to propose legislation reducing deficits by another $1.2 trillion over ten years, and established sequestration as a back-up procedure to increase the incentive on the Joint Committee to reach a compromise. Because the Joint Committee failed to achieve its goal, sequestration began in March 2013 and is scheduled to continue through 2021.
[5] The Budget Control Act’s sequestration provisions require that funding for all non-defense discretionary programs subject to sequestration be reduced across-the-board in 2013. For that reason, funding for all non-exempt programs has been cut by 5 percent this fiscal year. Starting in 2014, Congress will have authority to determine the specific cuts required to meet the additional reductions required under sequestration. While it is theoretically possible that state and local aid could be spared additional cuts, there is no chance of this actually occurring. As with the cuts required by the BCA’s spending caps, state and local aid is more likely to see a disproportionately large share of the cuts under sequestration if sequestration is allowed to go forward.
[6] Federal Highway Administration, “2010 Status of the Nation's Highways, Bridges, and Transit: Conditions & Performance,” pp. 2-12, http://www.fhwa.dot.gov/policy/2010cpr/pdfs/chap2.pdf.
[7] Federal Transit Administration, Archived Apportionments, http://www.fta.dot.gov/grants/15032.html
[8] Federal Aviation Administration,“Funding and Grant Breakdown by Service Level,” http://www.faa.gov/airports/aip/grant_histories/media/fy2011_aip_grants_states.pdf.
[9] U.S. Department of Education, “Improving Basic Programs Operated by Local Educational Agencies (Title I, Part A),” http://www2.ed.gov/programs/titleiparta/index.html.
[10] National Center for Education Statistics, “The Condition of Education,” http://nces.ed.gov/programs/coe/indicator_cwd.asp.
[11] U.S. Department for Health and Human Services, “Head Start Program Fact Sheet Fiscal Year 2011,” http://eclkc.ohs.acf.hhs.gov/hslc/mr/factsheets/2011-hs-program-factsheet.html
[12] U.S. Department of Education, “Findings from the 2011-12 Survey on the Use of Funds Under Title II, Part A,” March 2012, p. 4, http://www2.ed.gov/programs/teacherqual/finalfindings32312.pdf.
[13] National Association of Federally Impacted Schools,“Impact Aid Challenges – In Their Own Words,”p. 5, http://www.nafisdc.org/#!publications.
[14] National Association of Federally Impacted Schools, “Getting a Grip on the Basics of Impact Aid,” July 2009, http://militarystudent.whhive.com/Content/Media/File/MISA/thebasics.pdf
[15] Douglas Rice, “Policy Basics: The Housing Choice Voucher Program,” Center on Budget and Policy Priorities, January 25, 2013, https://www.cbpp.org/cms/index.cfm?fa=view&id=279.
[16] Douglas Rice, “Policy Basics: Section 8 Project-Based Rental Assistance,” Center on Budget and Policy Priorities, January 25, 2013, https://www.cbpp.org/cms/index.cfm?fa=view&id=3891.
[17] U.S. Department of Health and Human Services, “Low Income Home Energy Assistance Program: Report to Congress for Fiscal Year 2008,” http://www.acf.hhs.gov/programs/ocs/liheap/publications/liheap08rc.pdf.
[18] U.S. Department of Housing and Urban Development, “Community Development Block Grant Program – CDBG,” www.hud.gov/cdbg.
[19] Douglas Rice, “Policy Basics: Introduction to Public Housing,” Center on Budget and Policy Priorities, January 25, 2013, https://www.cbpp.org/cms/index.cfm?fa=view&id=2528.
[20] U.S. Department of Agriculture, Program Information Report, U.S. Summary FY 2012 – FY 2013, December 2012, http://www.fns.usda.gov/sites/default/files/datastatistics/Keydata%20December%202012%20%283-8-2013%29_0.pdf.
[21] U.S. Environmental Protection Agency, “Clean Water State Revolving Fund Programs, 2009 Annual Report,” http://water.epa.gov/grants_funding/cwsrf/upload/2009_CWSRF_AR.pdf.
[22] Substance Abuse and Mental Health Services Administration, “FY 2012 Online Performance Appendix,” http://www.samhsa.gov/Budget/FY2012/SAMHSA-FY12CJ-OPA.pdf.
[23] National Association of Community Health Centers, “Key Health Center Data by State, 2011,” http://www.nachc.com/client/2012%20Key%20data.pdf.
[24] U.S. Department of Labor, “Labor Market and Workforce Information, Workforce Investment Act Adult Program,” http://www.doleta.gov/programs/wia.cfm.
[25] U.S. Department of Health and Human Services, “FY 2010 CCDF Data Tables (Preliminary Estimates),” http://www.acf.hhs.gov/programs/ccb/data/ccdf_data/10acf800_preliminary/table1.htm.
[26] U.S. Department of Education, “Adult Education – Basic Grants to States,” http://www2.ed.gov/programs/adultedbasic/index.html.
[27] Bureau of Justice Assistance, Quarterly Performance Update: Justice Assistance Grant (JAG) Program
[28] U.S. Department of Justice, “COPS and the Hiring Program- By the Numbers,” http://www.cops.usdoj.gov/pdf/2012AwardDocs/CHP/CHPQuickFacts.pdf
[29] For historical reasons, the funding provided for transportation programs from the Highway, Mass Transit, and Airport and Airways trust funds — which is called “contract authority” and is determined by periodic legislation within the jurisdiction of House and Senate transportation authorizing committees — is counted as mandatory budget authority. The amount of this funding that is actually available each year, however, is set by obligation limits enacted in annual appropriation acts. While those obligation limits are not counted as providing budget authority, the expenditures flowing from the funding made available by them are counted as discretionary outlays.
[30] For more on how sequestration would occur, see Richard Kogan, “Sequestration by the Numbers,” Center on Budget and Policy Priorities, March 21, 2013, https://www.cbpp.org/cms/index.cfm?fa=view&id=3937.
[31] These cuts are shown in the budget resolution in budget functions 920 (“Allowances”) and 930 (“Government-Wide Savings”), which do not contain any programs and are used to show cuts or other budget changes that have yet to be allocated among the regular budget functions.
More from the Authors

Areas of Expertise
