Downturn and Legacy of Bush Policies Drive Large Current Deficits
Economic Recovery Measures, Financial Rescues Have Only Temporary Impact
This analysis has been updated. To view the updated analysis, click here.
Some lawmakers, pundits, and others continue to say that President George W. Bush’s policies did not drive the projected federal deficits of the coming decade — that, instead, it was the policies of President Obama and Congress in 2009 and 2010. But, the fact remains: the economic downturn, President Bush’s tax cuts and the wars in Afghanistan and Iraq explain most of the deficit over the next ten years — according to this update of our analysis, which is based on the Congressional Budget Office’s most recent ten-year budget projections (from August) and congressional action since we released the previous version of this analysis in May 2011. (For a fuller discussion, see the technical note that begins on p. 6.)
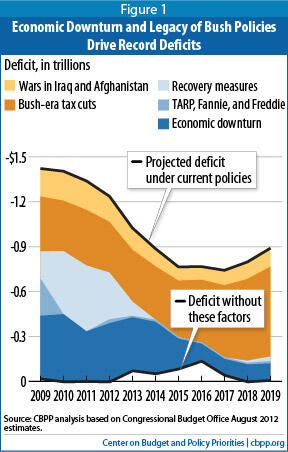
The deficit for fiscal year 2009 — which began more than three months before President Obama’s inauguration — was $1.4 trillion and, at 10 percent of Gross Domestic Product (GDP), the largest deficit relative to the economy since the end of World War II. At $1.3 trillion and nearly 9 percent of GDP, the deficits in 2010 and 2011 were only slightly lower. If current policies remain in place, deficits will likely exceed $1 trillion in 2012 and 2013 before subsiding slightly, and never fall below $700 billion for the remainder of this decade.
President Obama, however, still has a responsibility to propose, and put the weight of his office behind, policies that will address our key long-term fiscal challenge — preventing the significant rise in debt as a percentage of GDP that will occur under current policies. Allowing the flagship Bush tax cuts — which initially were slated to end after 2010 and were extended for two years — to expire on schedule at the end of 2012 would halt the rise in the debt-to-GDP ratio. In fact, that step — or an equivalent, substitute package of deficit reductions — would reduce the debt-to-GDP ratio and stabilize it at about 70 percent in the second half of the decade. Of course, with the economy still fragile, it is prudent to continue the middle-class portion of the tax cuts for a while longer. But there is no justification for extending the entire set of expiring tax cuts indefinitely. To keep the debt stable over the longer run, when the fiscal impacts of an aging population and rising health care costs will continue to mount, policymakers will need to take large additional steps on both the expenditure and revenue sides of the budget.
Having said that, policymakers should not mistake the causes of the swollen deficits that we face in the decade ahead nor make policy based on mistaken impressions.
Recession Caused Sharp Deterioration in Budget Outlook
Whoever won the presidency in 2008 was going to face a grim fiscal situation, a fact already well known as the presidential campaign got underway. The Congressional Budget Office (CBO) presented a sobering outlook in its 2008 summer update,[2] and during the autumn, the news got relentlessly worse. Fannie Mae and Freddie Mac, the two government-sponsored enterprises (GSEs) that became embroiled in the housing meltdown, failed in early September; two big financial firms — AIG and Lehman Brothers — collapsed soon thereafter; and others teetered. In December 2008, the National Bureau of Economic Research confirmed that the nation was in recession and pegged the starting date as December 2007. By the time CBO issued its new projections on January 7, 2009 — two weeks before Inauguration Day— it had already put the 2009 deficit at well over $1 trillion.[3]
The recession battered the budget, driving down tax revenues and swelling outlays for unemployment insurance, food stamps, and other safety-net programs.[4] Using CBO’s August 2008 projections as a benchmark, we calculate that the changed economic outlook alone accounts for over $400 billion of the deficit in both 2009 and 2010 and declining amounts in subsequent years. Those effects persist; even in 2018, the deterioration in the economy since the summer of 2008 will account for over $100 billion in added deficits, much of it in the form of additional debt-service (that is, interest) costs.
Financial Rescues, Stimulus Added to Deficits in Near Term
The government put Fannie Mae and Freddie Mac into conservatorship in September 2008.[5] In October of that year, the Bush Administration and Congress enacted a rescue package to stabilize the financial system by creating the Troubled Asset Relief Program (TARP). Together, TARP and the GSEs accounted for almost $250 billion (including extra debt-service costs) of fiscal year 2009’s record deficit. Their contribution to deficits then fades quickly, however (see Figure 1).
In February 2009, the new Obama Administration and Congress enacted a major package — the American Recovery and Reinvestment Act (ARRA) — to arrest the economy’s plunge. Mainstream economic theory holds that to combat the recession, the federal government should loosen its purse strings temporarily to spur demand, which can be achieved through a mix of assistance to the unemployed, aid to strapped state and local governments, tax cuts, spending on infrastructure, and other measures. By design, this package added to the deficit. Since then, policymakers have enacted several other measures — including tax cuts for businesses, modest additional temporary aid to states, a partial payroll-tax holiday for workers, and further extensions of unemployment benefits — to spur recovery and aid the unemployed.[6] By our reckoning, the combination of ARRA and these other measures, including their associated debt-service costs, account for $1.5 trillion of the nearly $11 trillion in deficits over the 2009-2019 period. Their effects are highly concentrated in 2009 through 2012 and fade thereafter, delivering a boost to the economy during its most vulnerable period.[7]
Tax Cuts, War Costs Do Lasting Harm to Budget Outlook
Some commentators blame major legislation adopted since 2008 — the stimulus bill and other recovery measures and the financial rescues — for today’s record deficits. Yet those costs pale next to other policies enacted since 2001 that have swollen the deficit. Those other policies may be less conspicuous now, because many were enacted some years ago and they have long since been absorbed into CBO’s and other organizations’ budget projections.
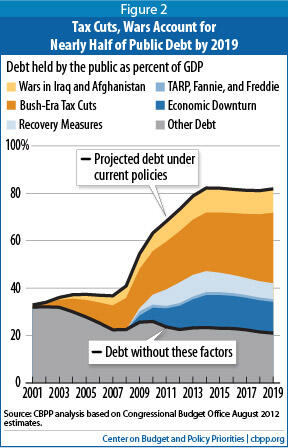
Without the economic downturn and the fiscal policies of the previous Administration, the budget would be roughly in balance over the next decade. That would have put the nation on a much sounder footing to address the demographic challenges and the cost pressures in health care that darken the long-run fiscal outlook.[10]
A Simple Step to Stabilize the Fiscal Outlook
The key question is: where do we go from here? It’s too late to undo the damage caused by the tax cuts and wars over the last decade, which have left us with a large overhang of debt. (In fact, that debt legacy — and the resulting interest costs — are a key reason, along with an aging population and rising health-care costs, that it’s unrealistic and ill-advised to restrict total federal spending to the average outlay levels that prevailed over the 1970-2008 period, as some have proposed.[11] ) But it’s feasible to enact measures now — to take effect once the economy has recovered more fully — that would put the budget on a sustainable path without jeopardizing the economic recovery.
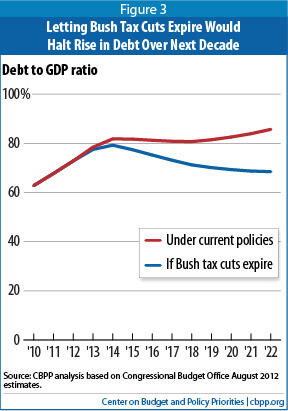
Letting those tax cuts lapse on schedule — for everybody, not just for people with incomes over $200,000 for an individual or $250,000 for a couple — would put deficits and debt on a sustainable path for the next decade and even reduce the debt-to-GDP ratio late in the decade, as Figure 3 shows. Of course, with the economy still fragile, it is prudent to continue the middle-class portion of the tax cuts for a while longer. But there is no justification for extending the entire set of expiring tax cuts indefinitely.
Much more would need to be done to keep us on a sustainable course for decades after that; letting the Bush tax cuts lapse wouldn’t by itself solve our longer-term fiscal challenges. Congress will need to use findings from demonstrations, pilots, and research on cost containment conducted under the health reform law to take very strong steps to slow the growth of costs throughout the U.S. health care system, in the public and private sectors alike; these rising costs are the greatest threat to the nation’s fiscal future. Congress also ought to tackle fundamental tax reform to make the tax code simpler, fairer, and more economically efficient, while also raising more revenue.[13] And Congress needs to address the long-term imbalance in Social Security, which poses a smaller but still significant challenge.[14]
Any changes in eligibility or benefits in Medicare and Social Security will need to be designed carefully and phased in gradually, with ample notice to workers and recipients. Letting the Bush tax cuts lapse would stabilize the debt quickly and give policymakers time to get the rest of the job done right.
Technical Note
Baseline projections depict the likely path of the federal budget if current policies remain unchanged. We base our estimates on CBO’s latest ten-year projections, published in August 2012, with several adjustments to reflect what will happen if current tax and spending policies continue (see Table 1).
| Table 1 Projected Deficits Under Current Policies (By fiscal year, in billions of dollars; details may not add to totals due to rounding) | ||||||||||||||
| 2009 | 2010 | 2011 | 2012 | 2013 | 2014 | 2015 | 2016 | 2017 | 2018 | 2019 | 2020 | 2021 | 2022 | |
| CBO baseline | 1,413 | 1,294 | 1,300 | 1,128 | 641 | 387 | 213 | 186 | 123 | 79 | 130 | 142 | 144 | 213 |
| Extend individual income- and estate-tax cuts that expire in 2013 | 0 | 0 | 0 | 0 | 108 | 214 | 254 | 268 | 283 | 297 | 310 | 322 | 334 | 346 |
| Extend other expiring tax provisions | 0 | 0 | 0 | 0 | 84 | 102 | 95 | 91 | 86 | 83 | 82 | 84 | 89 | 95 |
| Index AMT for inflation | 0 | 0 | 0 | 0 | 103 | 42 | 49 | 57 | 66 | 78 | 92 | 107 | 125 | 144 |
| Interaction of AMT relief and tax-cut extension | 0 | 0 | 0 | 0 | 35 | 62 | 70 | 79 | 89 | 99 | 109 | 119 | 129 | 139 |
| Cancel sequestration | 0 | 0 | 0 | 0 | 54 | 96 | 102 | 104 | 105 | 105 | 105 | 105 | 104 | 93 |
| Cancel scheduled physician-fee cuts | 0 | 0 | 0 | 0 | 10 | 16 | 18 | 20 | 22 | 24 | 28 | 32 | 36 | 40 |
| Adjust for phase-down in Iraq and Afghanistan | 0 | 0 | 0 | 0 | -22 | -46 | -72 | -88 | -95 | -100 | -103 | -106 | -108 | -111 |
| Additional debt service | 0 | 0 | 0 | 0 | 1 | 5 | 9 | 25 | 52 | 91 | 129 | 168 | 209 | 253 |
| Total adjustments | 0 | 0 | 0 | 0 | 374 | 490 | 524 | 556 | 609 | 679 | 751 | 830 | 916 | 1,001 |
| CBPP baseline | 1,413 | 1,294 | 1,300 | 1,128 | 1,015 | 877 | 737 | 742 | 731 | 758 | 881 | 972 | 1,061 | 1,214 |
| Source: CBPP calculations based on Congressional Budget Office, An Update to the Budget and Economic Outlook: Fiscal Years 2012 to 2022 (August 2012), Table 1-5, “Budgetary Effects of Selected Policy Alternatives Not Included in CBO’s Baseline.” | ||||||||||||||
Specifically, our baseline includes the budgetary effects of continuing the tax cuts — originally enacted in the George W. Bush administration and extended in December 2010 — that are scheduled to expire after 2012 (including tax cuts for upper-income taxpayers), renewing other so-called “normal tax extenders” such as the research and experimentation tax credit, and continuing relief from the Alternative Minimum Tax (AMT). Our baseline also assumes the effects of continuing to defer scheduled cuts in payments for Medicare providers (including a 27 percent reduction scheduled for 2013), as has routinely occurred in recent years, and instead freezing reimbursements at today’s rates. We also account for a gradual phase-down of operations in Iraq and Afghanistan. And finally, we assume that the automatic spending reductions (or “sequestration”) scheduled to take place starting in January 2013 will be cancelled. We do, however, assume compliance with the discretionary spending caps enacted in the Budget Control Act of 2011. In all cases we based our adjustments on estimates published by CBO.[15]
We calculated major components of the deficits as follows:
- Economic downturn — This category includes all changes in the deficit that CBO has labeled “economic” in the numerous reports[16] that it has issued since September 2008, which total $0.7 trillion over the 2009-2018 period. It also includes the bulk of revenue changes that CBO has classified as “technical.” In the revenue area, so-called technical changes essentially refer to trends in revenue collections that CBO’s analysts cannot tie directly to published macroeconomic data. (Those data become available with a lag and are subject to major revision; weak revenues are often a tipoff that the economy is worse than the official statistics suggest. Furthermore, some key determinants of revenues — such as capital gains on stock-market transactions — are tied to the economy, but those influences are not captured by the standard macroeconomic indicators.) Because the economic-versus-technical distinction is somewhat arbitrary for revenues, we have ascribed most of CBO’s large, downward “technical” reestimates of revenues to the economic downturn. We add the associated debt-service costs. The technical reestimates to revenues and the associated debt-service costs add $1.9 trillion and $0.2 trillion, respectively, to this category over the 2009-2018 period.
Combined, the factors that we ascribe to the economic downturn account for $2.8 trillion in extra deficits in 2009 through 2018 (see Table 2).[17] - TARP, Fannie, and Freddie — The Treasury spent $247 billion for these entities in 2009 ($151 billion for TARP and $96 billion for purchases of stock in Fannie Mae and Freddie Mac). In 2010 — and to a lesser extent in 2011 — TARP actually reduced the deficit (while Fannie Mae and Freddie Mac continued to require outlays). Projections for 2012 and beyond come from CBO’s August 2012 baseline. We computed the additional debt-service costs, which total $44 billion over the 2009-2019 period. (By 2017, most of the cost shown in Table 1 represents debt-service costs.)
| Table 2 Selected Components of Deficits Under Current Policies, Through 2019 (By fiscal year, in billions of dollars) | |||||||||||||
| 2009 | 2010 | 2011 | 2012 | 2013 | 2014 | 2015 | 2016 | 2017 | 2018 | 2019 | 2001-08 | 2009-19 | |
| Economic downturn | 418 | 449 | 332 | 388 | 354 | 344 | 199 | 114 | 106 | 113 | n.a. | 0 | 2,816a |
| TARP, Fannie, and Freddie | 249 | -66 | -30 | 26 | 10 | 14 | 10 | 8 | 10 | 11 | 16 | 0 | 257 |
| ARRAb | 182 | 328 | 171 | 58 | 51 | 44 | 18 | 6 | 13 | 20 | 31 | 0 | 920 |
| Other recovery measures | 0 | 93 | 269 | 255 | 44 | -45 | -36 | -21 | -14 | -6 | -1 | 0 | 538 |
| Bush-era tax cuts | 366 | 337 | 372 | 338 | 346 | 357 | 378 | 419 | 482 | 546 | 600 | 1,939 | 4,541 |
| War costs | 178 | 188 | 184 | 163 | 137 | 109 | 83 | 79 | 91 | 105 | 115 | 673 | 1,432 |
| Source: CBPP calculations based on data from CBO. All estimates include the associated debt-service costs. “n.a.” denotes “not available.” a. Through 2018. (Not available for 2019.) b. Excluding cost of a one-year AMT “patch,” which was included in ARRA. Note: CBO=Congressional Budget Office; TARP=Troubled Asset Relief Program; Fannie and Freddie=Fannie Mae and Freddie Mac; ARRA=American Recovery and Reinvestment Act of 2009; AMT=Alternative Minimum Tax. | |||||||||||||
- Recovery measures — When ARRA was passed, it bore a “headline” cost of $787 billion as officially estimated by CBO.[18] In August 2012, CBO revised that figure to $833 billion, chiefly to reflect higher costs due to such economic variables as the unemployment rate and food prices, partially offset by rescissions and other legislation curtailing ARRA’s original provisions.[19] We removed the portion of ARRA costs ascribed to indexing the AMT for another year.[20] Annual AMT “patches” have been a fixture since 2001, and ARRA just happened to provide the vehicle. The AMT provision accounted for $70 billion of ARRA’s $833 billion cost, leaving $763 billion. CBPP then added the cost of several smaller, discrete recovery measures that were enacted after ARRA, totaling $443 billion in the 2010-2019 period (heavily concentrated in 2010 through 2012). These measures include:
- Laws enacted in late 2009 to extend tax carryback provisions for businesses, the first-time homebuyer tax credit, and COBRA tax subsidies for unemployed workers (P.L. 111-92 and P.L. 111-118);
- Extensions of unemployment insurance benefits and COBRA subsidies in P.L. 111-144;
- The Hiring Incentives to Restore Employment Act, P.L. 111-147;
- Further extensions of unemployment insurance in P.L. 111-157 and P.L. 111-205;
- State fiscal relief in P.L. 111-226;
- Tax relief for small businesses in P.L. 111-240;
- Numerous provisions of the December 2010 tax law (P.L. 111-312) not related to extension of the 2001 and 2003 Bush tax cuts, including temporary extensions of certain earned-income, child, and educational tax credits originally enacted in ARRA; investment incentives; unemployment compensation benefits; and a one-year payroll tax holiday that shaved the contribution rate to Social Security by 2 percentage points (with the trust funds compensated by a general-fund transfer);
- The Temporary Payroll Tax Cut Continuation Act of 2011 (P.L. 112-78) and the Middle Class Tax Relief and Job Creation Act of 2012 (P.L. 112-96), which extended certain unemployment-compensation benefits and the temporary payroll-tax holiday through 2012.
We then added in the associated debt-service costs related to ARRA and the subsequent recovery measures, which amount to $156 billion and $96 billion, respectively, over the 2009-2019 period.
- Bush-era tax cuts — Through 2011, the estimated impacts come from adding up past estimates of various changes in tax laws enacted since 2001, chiefly the Economic Growth and Tax Relief Reconciliation Act of 2001 (EGTRRA), the Jobs and Growth Tax Relief Reconciliation Act of 2003 (JGTRRA), the 2008 stimulus package, and a series of annual AMT patches. Those estimates were based on the economic and technical assumptions used when CBO and the Joint Committee on Taxation (JCT) originally “scored” the legislation, but the numbers would not change materially using up-to-date assumptions. Most of the Bush tax cuts were scheduled to expire after 2010 but were continued for another two years in the December 2010 tax compromise. We added the cost of extending them further from estimates prepared by CBO and JCT.[21] Together, the tax cuts directly account for $1.7 trillion in extra deficits in 2001 through 2008 and $3.6 trillion over the 2009-2019 period. Finally, we added the extra debt-service costs caused by the Bush-era tax cuts, amounting to more than $200 billion through 2008 and another $1.0 trillion over the 2009-2019 period — over $230 billion in 2019 alone.
(Our estimate of the cost of the Bush tax cuts through 2011 exceeds that cited in some newspaper reports. To understand why, see the box on p. 13.) - War costs — Spending for operations in Iraq and Afghanistan and related activities cost $610 billion through fiscal 2008, according to CBO ($575 billion for the Department of Defense and $35 billion for international affairs); spending in 2009 through 2011 brought that total to $1.1 trillion.[22] We based estimates of costs in 2012 through 2019 on CBO’s projections, adjusted for a phase-down to 45,000 troops; those costs come to about $600 billion.[23] We add the associated debt-service costs, which came to $63 billion through 2008 and will total another $357 billion over the 2009-2019 period ($77 billion in 2019 alone).
What About the Medicare Prescription Drug Benefit?
One of the major domestic initiatives of the Bush Administration was enactment of the Medicare Prescription Drug, Improvement, and Modernization Act of 2003 (known informally as the Medicare Modernization Act, or MMA). The MMA created a new prescription-drug benefit in Medicare, known as Medicare Part D. This legislation was only partly paid for, and it added significantly to the deficit that President Obama inherited. Why is it absent from this analysis?
The Congressional Budget Office initially estimated that the MMA would add to the deficit by $395 billion over its first decade, spanning the years between 2004 and 2013. (Medicare’s chief actuary pegged the net cost significantly higher — $534 billion over that period.) CBO’s estimate consisted of $552 billion in net spending — new benefits, partially offset by premiums and by receipts from the states — for the drug benefit itself, minus $157 billion in savings in Medicaid and other federal programs. Although that “headline” estimate spanned ten years, costs were negligible in the first two years, because the new benefit took effect in January 2006.
Part D outlays are coming in somewhat lower than CBO and the Medicare actuary expected, but it is not possible to update the original price tag for the entire MMA.a CBO now expects the net cost of Medicare Part D over that initial 2004-2013 period to be about $360 billion (as compared to the original $552 billion figure). But, it is not possible to tell whether the savings in Medicaid and other programs have deviated from CBO’s original estimate of $157 billion. While Part D is a new, identifiable account in the federal budget, those other effects represent relatively small changes in large, ongoing programs.
In short, we did not include the costs of the prescription-drug program in this analysis because we could not estimate those net costs with the same confidence that we could estimate costs, based on CBO analyses, for other Bush-era policies — namely, the tax cuts and the wars in Iraq and Afghanistan. Over the 2009-2019 period that is this paper’s focus, CBO now expects net outlays for Part D to total approximately $765 billion (about $110 billion in 2019 alone), but some portion of that will be offset by savings in Medicaid and other programs that we are not able to estimate. Nevertheless, it is clear that, as noted above, enactment of the prescription-drug program added materially to the deficit that the current administration inherited.
a Edwin Park and Matt Broaddus, “Lower-Than-Expected Medicare Drug Costs Mostly Reflect Lower Enrollment and Slowing of Overall Drug Spending, Not Reliance on Private Plans,” Center on Budget and Policy Priorities, May 14, 2012.
Conspicuously missing from this list is the Medicare prescription-drug program that Congress enacted in 2003. That new program has also added significantly to deficits through 2019, but data limitations leave us unable to quantify its net budgetary effects (see the box above).
Allowing the Bush tax cuts to expire — or extending some portions while fully offsetting their cost — would reduce deficits by $4.3 trillion over the next decade.[24] That consists of $2.7 trillion from not extending the tax cuts themselves, about $900 billion from an interaction with continued AMT relief, and another $600 billion in debt-service savings. As Table 3 indicates, that strategy would, by itself, reduce and then stabilize the ratio of federal debt to GDP for the next decade (at about 70 percent of GDP).
| Table 3 Effects on Federal Deficits and Debt of Allowing Bush-Era Tax Cuts to Expire (By fiscal year, in billions of dollars; details may not add to totals due to rounding) | |||||||||||||
| 2012 | 2013 | 2014 | 2015 | 2016 | 2017 | 2018 | 2019 | 2020 | 2021 | 2022 | 2013-22 | ||
| Federal deficit | |||||||||||||
| CBPP baseline deficit | 1,128 | 1,015 | 877 | 737 | 742 | 731 | 758 | 881 | 972 | 1,061 | 1,214 | 8,987 | |
| Allow tax cuts to expire a | 0 | -144 | -277 | -323 | -347 | -372 | -396 | -419 | -441 | -463 | -486 | -3,668 | |
| Debt-service savings | 0 | * | -2 | -5 | -14 | -31 | -56 | -80 | -105 | -132 | -160 | -587 | |
| Resulting deficit | 1,128 | 871 | 598 | 408 | 380 | 329 | 306 | 382 | 426 | 465 | 568 | 4,733 | |
| Federal debt held by the public | |||||||||||||
| CBPP baseline | 11,318 | 12,438 | 13,409 | 14,250 | 15,089 | 15,923 | 16,768 | 17,729 | 18,777 | 19,910 | 21,194 | ||
| Without extension of tax cuts | 11,318 | 12,294 | 12,986 | 13,498 | 13,975 | 14,407 | 14,799 | 15,261 | 15,763 | 16,301 | 16,939 | ||
| Federal debt as a percent of GDP | |||||||||||||
| CBPP baseline | 72.8 | 78.4 | 81.8 | 81.7 | 81.2 | 80.8 | 80.7 | 81.5 | 82.6 | 83.9 | 85.7 | ||
| Without extension of tax cuts | 72.8 | 77.5 | 79.3 | 77.4 | 75.3 | 73.2 | 71.2 | 70.1 | 69.3 | 68.7 | 68.5 | ||
| Source: CBPP calculations based on data from CBO. a. Includes the direct cost of extending the tax cuts, and the interaction with indexation of the thresholds for the Alternative Minimum Tax (AMT), on the assumption that such AMT relief is still provided. | |||||||||||||
This report updates an analysis last conducted by CBPP in May 2011.[25] It thus takes into account over a year’s worth of revisions by CBO and of actions by Congress. Our projections of deficits and debt under current policies are lower than they were in May 2011, largely because we assume compliance with the discretionary spending caps in the Budget Control Act, which cut such funding significantly.[26] Our key conclusion — that those remaining deficits stem overwhelmingly from the economic downturn, the tax cuts, and the wars — is nevertheless very similar.
There are just two major changes to the components of the deficit that we list in Table 2. One is the passage of measures to extend the temporary payroll-tax holiday and certain unemployment benefits through 2012, which we add to other post-ARRA recovery measures. The second is revisions to CBO’s economic forecast, which have improved the outlook. Most notably, CBO has lowered its assumptions about future interest rates.[27] That benefits the budget outlook directly, and — more subtly — lessens the cost of all the components shown in Table 2 by reducing their associated debt-service costs.
Despite the apparent precision of the effects shown in Table 2, users should be aware of their limitations. This project involves tallying up estimates that were done at different times and that employed different economic and technical assumptions. For example, CBO does not generally revisit the effects of legislation once it is enacted, so many of the measures depicted in the table surely ended up costing more — or less — than initially “scored.”[28] Useful details (such as a breakdown of expiring tax provisions by particular provision and original enactment date) are unavailable. And more than three and a half years into the new Administration, President Obama has continued (with modifications) some policies that were begun in the Bush era, blurring the exact division of responsibility for those policies’ budgetary effects. In short, readers should be aware that these estimates are not definitive. Notwithstanding their limitations, however, they paint a clear picture of what lies behind the nation’s current fiscal woes.
What Did the Bush-Era Tax Cuts Cost Through 2011?
Some analysts, citing the same CBO data we use, assign a lower cost to the Bush tax cuts over the 2001-2011 period than we do. Why? In general, they focus only on the two flagship bills — the Economic Growth and Tax Relief Reconciliation Act of 2001 (EGTRRA) and the Jobs and Growth Tax Relief Reconciliation Act of 2003 (JGTRRA) — and only on those bills’ revenue effects. We regard that approach as too narrow.
| Cost of the Bush-Era Tax Cuts Through 2011 (by fiscal year, in billions of dollars) | ||||||||||||
| 2001 | 2002 | 2003 | 2004 | 2005 | 2006 | 2007 | 2008 | 2009 | 2010 | 2011 | Total, 2001-11 | |
| EGTRRA, JGTRRA, WFTRA, and TIPRA a | 74 | 38 | 151 | 256 | 219 | 209 | 213 | 204 | 214 | 213 | 127 | 1,917 |
| December 2010 extensions a b | 0 | 0 | 0 | 0 | 0 | 0 | 0 | 0 | 0 | 0 | 128 | 128 |
| AMT relief for 2007-2011 c | 0 | 0 | 0 | 0 | 0 | 0 | 0 | 70 | 62 | 68 | 71 | 271 |
| Other tax measures a d | 1 | 52 | 47 | 28 | 4 | -9 | 18 | 147 | 41 | 8 | -2 | 334 |
| Debt service | 2 | 5 | 8 | 14 | 27 | 45 | 60 | 59 | 49 | 48 | 49 | 364 |
| Total | 77 | 94 | 206 | 298 | 250 | 244 | 291 | 479 | 366 | 337 | 372 | 3,014 |
| Source: CBPP based on data from the Congressional Budget Office and Joint Committee on Taxation. a. Includes effects on refundable credits, which are outlays. b. Titles I (sections 101 and 102 only), III, and VII of P.L. 111-312. c. EGTRRA, JGTRRA, WFTRA, and TIPRA included AMT relief for tax years 2001 through 2006; for simplicity, those earlier effects are included with the rest of those measures. This line thus shows costs of separate AMT “patches” for 2007 through 2011. d. Chiefly the Job Creation and Worker Assistance Act of 2002 and three measures — the Economic Stimulus Act of 2008, the Housing Assistance Tax Act of 2008, and the Emergency Economic Stabilization Act of 2008 — enacted in 2008 as emergency responses to the economic downturn and to the crises in the housing and financial sectors. | ||||||||||||
Our analysis includes all tax laws enacted during the George W. Bush administration. EGTRRA and JGTRRA are the best-known, but even they must be viewed in tandem with two closely related measures, the Working Families Tax Relief Act of 2004 (WFTRA) and the Tax Increase Prevention and Reconciliation Act of 2005 (TIPRA, actually enacted in 2006). WFTRA extended several key provisions of EGTRRA and JGTRRA — notably the $1,000 child tax credit, marriage penalty relief, and the new 10 percent bracket — that were slated to expire sooner than the rest of the package; TIPRA did likewise for JGTRRA’s cut (to 15 percent) in the tax rate on qualified dividends and gains, an important part of the administration’s agenda.
These various tax cuts were scheduled to expire at the end of 2010. We include the cost of temporarily extending them in the December 2010 tax bill, an obvious legacy of the original cuts.
EGTRRA and JGTRRA necessitated a series of adjustments to keep the Alternative Minimum Tax (AMT) from snaring additional tens of millions of middle-income taxpayers. Policymakers included short-term “patches” to the AMT in EGTRRA, JGTRRA, WFTRA, and TIPRA (we include those patches with those measures’ costs, above); they attached subsequent patches to whatever tax bill offered a convenient vehicle. Specifically, we include here the AMT provisions only of the Tax Increase Prevention Act of 2007, the Emergency Economic Stabilization Act of 2008, the American Recovery and Reinvestment Act of 2009, and the Tax Relief, Unemployment Insurance Reauthorization, and Job Creation Act of 2010.
Other major measures enacted during this period include the Job Creation and Worker Assistance Act of 2002 (a package of primarily business tax cuts in the wake of the September 2001 terrorist attacks and the economic slump of that period) and three laws — the Economic Stimulus Act of 2008, the Housing Assistance Tax Act (part of the Housing and Economic Recovery Act of 2008), and the Emergency Economic Stabilization Act of 2008 — enacted in that year as emergency responses to the economic downturn and to the crises in the housing and financial sectors; their provisions were overwhelmingly temporary.
In all cases, we include outlay as well as revenue effects of the bills. EGTRRA, JGTRRA, and the 2008 stimulus and housing acts had significant effects on refundable credits, which are counted as budget outlays.
Finally, we count the extra debt-service costs that resulted from the tax cuts. Although CBO does not officially “score” interest costs, it is essential to include such costs when gauging any legislation’s contribution to deficits and debt, because those interest costs otherwise would not have occurred. We used actual interest rates over the 2001-2011 period, which were much lower than the rates that CBO assumed at the time of passage.
In sum, we find that the Bush-era tax cuts added $3 trillion to deficits in 2001 through 2011, or a little over one-fourth of the swing from surpluses to deficits over that period.
Congressional Budget Office, “Changes in CBO’s Baseline Projections Since January 2001,” June 7, 2012 (http://www.cbo.gov/sites/default/files/cbofiles/attachments/06-07-ChangesSince2001Baseline.pdf); Joint Committee on Taxation, various; Robert J. Samuelson, “The $12 trillion misunderstanding: Whose budget blunder?,” Washington Post, July 24, 2012; Greg Leiserson and Jeffrey Rohaly, “What is Responsible for the Growth of the AMT?,” Tax Policy Center (http://www.taxpolicycenter.org/UploadedPDF/901053_Responsible_AMT.pdf); Tax Policy Center, “Historical AMT Legislation” (http://www.taxpolicycenter.org/taxfacts/Content/PDF/amt_legislation_historical.pdf).
End Notes
[1] We focus here on debt held by the public, which reflects funds that the federal government borrows in credit markets to finance deficits and other cash needs. That’s the proper measure on which to focus because it’s what really affects the economy. We compare it to GDP because stabilizing the debt-to-GDP ratio is a key test of fiscal sustainability. See James R. Horney, Kathy Ruffing, and Paul N. Van de Water, “Fiscal Commission Should Not Focus On Gross Debt,” Center on Budget and Policy Priorities, July 21, 2010, and Kathy Ruffing, Kris Cox, and James R. Horney, “The Right Target: Stabilize the Federal Debt,” Center on Budget and Policy Priorities, January 12, 2010.
[2] Congressional Budget Office, The Economic and Budget Outlook: An Update (September 2008). As CBO itself acknowledged, its baseline employed some arguably unrealistic assumptions about the expiration of the Bush tax cuts and other policies; several other organizations pegged future deficits much higher than CBO’s official estimates. See, for example, the Concord Coalition, “Setting Expectations: Why Baselines Matter in the Presidential Campaign and for the Fiscal Future” (September 11, 2008); Cato Institute, “$1 Trillion Budget Deficit by 2017?” (September 11, 2008).
[3] Congressional Budget Office, The Budget and Economic Outlook: Fiscal Years 2009 to 2019 (January 2009).
[4] At the same time, the recession pushed down inflation and interest rates, which generated some offsetting savings.
[5] That occurred on September 7, 2008 — too late for inclusion in the CBO report issued just two days later.
[6] See the technical note at the end of this paper for the list of measures that we include here.
[7] CBO estimates that ARRA boosted employment in the United States by 0.9 million to 4.7 million in 2010 (on a full-time equivalent basis) and that real (inflation-adjusted) GDP was about 0.7 percent to 4.1 percent higher in 2010 than it would have been if ARRA had not been enacted. Under CBO’s latest analysis, ARRA’s impact on real GDP and employment peaked in the middle of 2010. Congressional Budget Office, Estimated Impact of the American Recovery and Reinvestment Act on Employment and Economic Output from April 2012 Through June 2012, August 2012, Table 1. A survey of distinguished economists by the University of Chicago’s Booth School of Business in February 2012 showed that 80 percent agreed or strongly agreed that ARRA reduced unemployment; when weighted by the confidence of the respondents in their analyses, the figure reached 90 percent agreement. See http://www.igmchicago.org/igm-economic-experts-panel/poll-results?SurveyID=SV_cw5O9LNJL1oz4Xi.
[8] As explained in the technical note at the end of the paper, this analysis assumes that expiring tax cuts will be extended and necessary funding will be provided to phase down operations in Iraq and Afghanistan.
[9] See Table 2 in the technical note at the end of this paper. These debt estimates simply sum up the policies’ effects on deficits over the two separate periods (2001-2008 and 2009-2019) shown there, including the associated interest costs.
[10] See Kathy Ruffing, Kris Cox, and James Horney, “The Right Target: Stabilize the Federal Debt,” Center on Budget and Policy Priorities, January 12, 2010.
[11] Paul N. Van de Water, “Corker-McCaskill Spending Cap Doesn’t Account for Basic Changes in Society and Government,” Center on Budget and Policy Priorities, February 1, 2011; Edwin Park, Kathy Ruffing, and Paul N. Van de Water, “Proposed Cap on Federal Spending Would Force Deep Cuts in Medicare, Medicaid, and Social Security,” Center on Budget and Policy Priorities, April 15, 2011.
[12] The tax cuts were originally slated to expire after 2010. In December 2010 lawmakers extended them for two years, through 2012. The legislation also included a two-year extension of some tax cuts in ARRA, a one-year reduction in the Social Security payroll tax for employees, and other temporary provisions. See Gillian Brunet and Chuck Marr, “Unpacking the Tax Cut-Unemployment Compromise,” Center on Budget and Policy Priorities, December 10, 2010.
[13] Paul N. Van de Water et al., “‘Supercommittee’ Should Develop Balanced Package of Tax Increases and Spending Cuts,” Center on Budget and Policy Priorities, September 27, 2011.
[14] Kathy Ruffing, “What the 2012 Trustees' Report Shows About Social Security,” Center on Budget and Policy Priorities, May 10, 2012.
[15] For a similar use of these adjustments to depict the budget outlook under current policies, see Alan J. Auerbach and William G. Gale, “An Updated Federal Budget Outlook: No News Is Bad News,” August 27, 2012 (available at http://www.brookings.edu/research/papers/2012/10/10-updated-budget-outlook-gale). The CBPP and Auerbach/Gale baselines closely track CBO’s “alternative fiscal scenario,” except that we (unlike CBO) assume a phasedown in Iraq and Afghanistan, which reduces our baseline deficits. The Tax Policy Center’s current policy baseline also makes the same revenue assumptions as CBO does in its “alternative fiscal scenario” and we do here, as does the Concord Coalition.
[16] Congressional Budget Office, The Economic and Budget Outlook (January 2009); A Preliminary Analysis of the President’s Budget and an Update of CBO’s Budget and Economic Outlook (March 2009); The Budget and Economic Outlook: An Update (August 2009); The Economic and Budget Outlook (January 2010); An Analysis of the President’s Budgetary Proposals for Fiscal Year 2011 (March 2010); The Economic and Budget Outlook: An Update (August 2010); The Economic and Budget Outlook (January 2011); An Analysis of the President’s Budgetary Proposals for Fiscal Year 2012 (April 2011); The Budget and Economic Outlook: An Update (August 2011); The Budget and Economic Outlook: Fiscal Years 2012 to 2022 (January 2012); Updated Budget Projections: Fiscal Years 2012 to 2022 (March 2012); and An Update to the Budget and Economic Outlook: Fiscal Years 2012 to 2022 (August 2012).
[17] Estimates are not available for 2019 because CBO’s August 2008 projections ended in 2018. For Figure 1, we assumed that this category would amount to $110 billion in 2019, a continuation of the previous few years’ pattern.
[18] See Congressional Budget Office, cost estimate for H.R. 1, American Recovery and Reinvestment Act of 2009 (February 13, 2009, online at www.cbo.gov) and Joint Committee on Taxation, “Estimated Budget Effects Of The Revenue Provisions Contained In The Conference Agreement For H.R. 1, The ‘American Recovery And Reinvestment Tax Act Of 2009’” (February 12, 2009, online at www.jct.gov).
[19] See CBO’s quarterly report on the economic impact of ARRA, August 2012, op. cit., which, in turn, modestly revised the estimates presented in Box 1-1, “Updated Estimates of the Budgetary Effects of the American Recovery and Reinvestment Act of 2009” in CBO January 2012.
[20] That one-year fix — made necessary by the interaction of the AMT and the 2001 and 2003 tax cuts — is instead combined with the “Bush-era tax cuts,” below.
[21] Table 1-5, CBO August 2012. Although they are dwarfed by the cost of the 2001 and 2003 tax-cut provisions, we removed from CBO’s estimate three ARRA provisions — enhancements to the earned-income and child tax credits and enactment of an American Opportunity Tax Credit for students — that were extended in December 2010, because they did not date from the Bush era. These three provisions cost about $26 billion a year.
[22] CBO January 2010, “Funding for Operations in Iraq and Afghanistan and Other Related Activities” (Box 1-1); CBO January 2012, “Funding for Operations in Afghanistan and Iraq and for Related Activities” (Box 3-2).
[23] CBO August 2012, Table 1-5.
[24] These effects are from CBO’s Table 1-5, op. cit. For simplicity, we include the entire line labeled “Extend Certain Income Tax and Estate and Gift Tax Provisions Scheduled to Expire on December 31, 2012” in CBO’s table. In fact, a small portion — about $26 billion a year, less than 10 percent of the total — actually reflects the assumed extension of certain earned-income, child, and education tax-credit provisions that were enacted in ARRA and temporarily renewed in December 2010.
[25] Kathy Ruffing and James Horney, “Economic Downturn and Bush Policies Continue to Drive Large Projected Deficits,” Center on Budget and Policy Priorities, May 10, 2011.
[26] Richard Kogan, “Congress Has Cut Discretionary Funding By $1.5 Trillion Over Ten Years,” Center on Budget and Policy Priorities, September 25, 2012.
[27] In 2019, CBO now assumes that three-month Treasury bill rates will average 3.8 percent and ten-year Treasury notes will average 5 percent. Those are down by 0.7 and 0.4 percentage points, respectively, from the rates that CBO assumed in early 2011. The difference in CBO’s assumptions over the entire 2012-2019 period — which is more significant for this analysis — is even more striking. Over that period, CBO now assumes that the interest rate on Treasury bills will average 1.6 percent, and the rate on Treasury notes will average 3.4 percent; those rates are 2.0 and 1.5 percentage points, respectively, below what CBO assumed in early 2011.
[28] ARRA is an exception to the rule that CBO doesn’t revisit the effects of past legislation. CBO has regularly updated its estimates of ARRA, as amended, partly in response to the transparency and accountability provisions of that Act. See, for example, Box 1-1 in CBO’s January 2012 report, op. cit.
More from the Authors

Areas of Expertise