Testimony of Robert Greenstein, President, Center on Budget and Policy Priorities, Before the Senate Committee on Finance
Mr. Chairman and distinguished members of the Finance Committee, I appreciate the invitation to testify here today. As we all know, the nation faces fiscal and economic challenges, and we will have to make some tough decisions to put the budget on a more sustainable fiscal course and to do so without hindering a still-too-weak economic recovery.
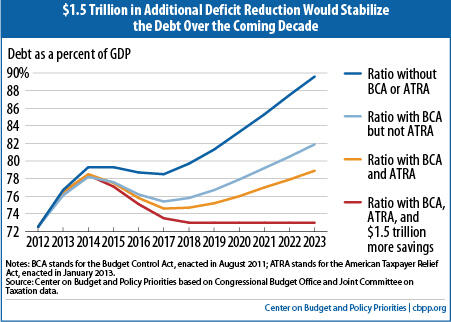
Earlier this month, we issued an analysis which finds (based on the new Congressional Budget Office projections, with several adjustments that analysts commonly make to reflect the cost of continuing current policies[1] ) that policymakers could stabilize the public debt as a share of the economy over the coming decade with $1.5 trillion in additional deficit reduction. Policymakers could achieve these savings with $1.3 trillion in policy savings (that is, spending cuts and revenue increases), which would generate about $200 billion in savings in interest payments. The $1.5 trillion in total savings would stabilize the debt at 73 percent of gross domestic product (GDP) over the latter part of the decade. (Stabilizing the debt at a somewhat lower level of GDP would require a larger amount of deficit reduction; stabilizing at a somewhat higher level of GDP would require a lesser amount of deficit reduction.)
| Table 1 Deficit Reduction to Stabilize the Debt Cumulative totals, 2014-2023, in billions | |||
| Policy savings | Interest savings | Total deficit reduction | |
| Discretionary savings from cuts in 2011 funding and caps imposed by the BCA | 1,576 | 336 | 1,912 |
| Savings from the ATRA | 732 | 117 | 850 |
| Further savings to stabilize debt at 73% of GDP | 1,327 | 202 | 1,529 |
| TOTAL | 3,636 | 655 | 4,290 |
| Notes: BCA stands for the Budget Control Act, August 2011; ATRA stands for the American Taxpayer Relief Act, January 2013; all savings measured relative to current policy (see Appendix I) Source: Center on Budget and Policy Priorities based on Congressional Budget Office and Joint Committee on Taxation data. | |||
The fact that $1.5 trillion in deficit savings, rather than a much larger amount, would stabilize the debt over the coming decade at about the 2012 debt-to-GDP ratio of 73 percent of GDP is due primarily to two factors. First, Congress and the President have enacted significant deficit reduction over the two-plus years since the Bowles-Simpson report and Rivlin-Domenici task force made major deficit reduction proposals; over this period, policymakers have enacted nearly $1.5 trillion in spending cuts for appropriated programs (relative to the CBO baseline in use at the time of the Bowles-Simpson and Rivlin-Dominici reports), mainly through the annual caps enacted in the 2011 Budget Control Act and nearly $600 billion in revenue increases in the American Taxpayer Relief Act (ATRA). Including the related savings in interest payments, policymakers have achieved about $2.35 trillion in deficit reduction so far. (Other analysts, like those at the Committee for Responsible Federal Budget, use the same $2.35 trilliion savings estimate.) These savings are for the ten-year budget window of 2013-2022. Over the new budget window of 2014-2023, the same policies are estimated to produce savings of $2.75 trillion, as Table 1 indicates.
Is Stabilizing the Debt the Right Target?
Stabilizing the debt-to-GDP ratio over the coming decade — so the debt grows no faster than the economy — is the minimum appropriate budget policy. Stabilizing the debt at 73 percent of GDP would require shrinking annual deficits to below 3 percent of GDP.
Stabilizing the debt ratio for the decade ahead would require that policymakers subsequently enact additional deficit reduction for the long term. In ensuing decades, the aging of the population and increases in per-capita health care costs (which are likely to rise faster than per-capita GDP) will raise costs for health and retirement programs, returning the budget to a path where debt is increasing as a share of the economy.
Some call for greater deficit reduction now in order to achieve a declining debt ratio, citing these long-term trends. Enacting larger deficit reduction now would require deeperprogram cuts, larger tax increases, or both. Enacting a larger amount of deficit reduction now would be desirable if policymakers can secure it without doing harm in other areas — that is, if policymakers can achieve it through policies that: do not impede the economic recovery or jeopardize future productivity growth by providing inadequate resources for areas like education, infrastructure, and basic research; don’t increase poverty and inequality, which already are higher here than in many other Western nations, or raise the number of Americans who are uninsured; and don’t sacrifice health care quality or increase overall U.S. health care costs.
This brings me to a related point. It is not just the quantity of deficit reduction that matters; the quality of the deficit reduction measures chosen matters as well.
This is particularly true in the health care area — where knowledge about effective ways to slow health care cost growth without risking the quality of care or jeopardizing access to needed care remains limited at the present time, with policy remedies still elusive, and where such knowledge is likely to be greater in coming years due to changes underway in the health care sector and various research and demonstration projects.
Policymakers can enact measures now, as part of a balanced deficit-reduction package, that would achieve significant Medicare savings (a few hundred billion dollars over ten years) without jeopardizing the quality of care or access to care. Rushing now to enact cuts much deeper than that in federal health spending, however, could result in measures that largely shift costs to states, individuals, and private employers and harm some of the most vulnerable members of society, while failing to address the underlying causes of the unsustainable growth in costs across the U.S. health care system. Indeed, analysts have found that some proposals to enact large cuts now in Medicare or other health programs would actually increasetotal U.S. health care costs, not a desirable outcome.
Stabilizing the debt for the coming decade would give policymakers time to figure out how to take the further steps that will be needed to slow the growth of health care costs throughout the U.S. health care system without impairing the quality of care. Stabilizing the debt during the decade ahead won’t permanently solve our fiscal problems, but it would represent a significant accomplishment.
Designing Deficit Reduction
Given the continued weakness in the U.S. economy, with the unemployment rate still close to 8 percent and CBO projecting it will take four more years before the economy recovers fully, deficit reduction needs to be designed very carefully to avoid making the recovery even slower. Deficit reduction should be phased in over coming years. In fact, policymakers really should couple some temporary fiscal measures to accelerate growth and job creation now with permanent deficit reduction measures.
As noted, the design of permanent deficit reduction measures matters. As I’ve indicated, we recommend that deficit reduction be secured through well-designed, balanced policies that don’t impede the economic recovery, jeopardize future productivity growth, increase poverty and inequality, or sacrifice access to health care or health care quality. For the remainder of my testimony, let me discuss a few issues related to deficit-reduction design: 1) its immediate effect on the economy; 2) how it affects the disadvantaged; 3) some issues related to health care and elderly individuals; and 4) the debate over revenue increases versus spending cuts.
1. Implementing or Replacing Sequestration and the Effect on the Economy
We all know that the impending automatic, across-the-board cuts, which affect both defense and non-defense programs, represent unsound policy. The point I want to make here is that replacement savings, which I hope policymakers will be able to agree upon, should be enacted now but be designed so that the budget cuts and/or revenue increases involved largely or entirely take effect after the economy has more fully recovered. As the economy’s poor performance in the 4th quarter of 2012 indicates, it would be injurious to growth and jobs to institute either sequestration or alternative savings measures right now. This is reflected in CBO’s estimate that by the fourth quarter of this year, sequestration would cut 0.6 percentage points off of GDP growth and cost 750,000 jobs.
2. Protecting the Disadvantaged
The Bowles-Simpson report made it a core principle that deficit reduction should not increase poverty or harm the disadvantaged. It largely shielded core programs for the disadvantaged from the cuts it recommended. And in the revised plan they released last week, Erskine Bowles and Alan Simpson reiterated that principle and said “Broad-based entitlement reforms should either include protections for vulnerable populations or be coupled with changes designed to strengthen the safety net for those who rely on it the most.” Bowles and Simpson have also called for revenue increases to be designed so they maintain or improve the progressivity of the tax code.
These principles and design features also are reflected in the plan presented in July 2011 by the Senate’s bipartisan “Gang of Six.” These principles have been highlighted as well by a group of Christian leaders that ranges from the Catholic Bishops’ Conference and the Episcopal Church to the Salvation Army and the National Association of Evangelicals, which has issued a call for policymakers to safeguard the poor in deficit reduction and draw a “circle of protection” around programs targeted on them.
Our current system of supports for low-income families and individuals surely isn’t perfect. But it does a great deal of good for tens of millions of our less fortunate fellow citizens. Using a measure of poverty that many analysts favor because it counts rather than ignores major benefits like food stamps and refundable tax credits — the Census Bureau’s Supplemental Poverty Measure — we see that the poverty rate would have been 29 percent in 2011 without government assistance. Yet it stood at about 16 percent when those benefits were counted. The safety net cuts U.S. poverty nearly in half, compared to what it would otherwise be.
One can also look at the Census data on how many people individual programs lift out of poverty. In 2010, for example, the Earned Income Tax Credit (EITC) and the Child Tax Credit (CTC) lifted about 9 million people in low-income working families above the poverty line, including nearly 5 million children. (SNAP, formerly called the Food Stamp Program, lifted about 4 million out of poverty.)
Some argue that in the absence of safety net programs, some people might have worked more. But the impact of the safety net on poverty — including its effect on work — has been extensively studied. In a recent comprehensive review and synthesis of the research literature, some of the field’s leading scholars examined the impact of means-tested programs on the amount that people work and found the programs’ overall impact on work to be small. They also found that, after taking behavioral effects into account, the safety net lowers the U.S. poverty rate by approximately 14 percentage points. In other words, one of every seven Americans — more than 40 million people — would be poor without the safety net but is above the poverty line because of it.[2]
Refundable tax credits, which this Committee has jurisdiction over, are of particular note. A strong body of research finds that the Earned Income Tax Credit not only reduces poverty but also increases work substantially, especially among single mothers.[3] The research indicates that the expansions of the EITC in the 1990s had as large or larger an effect in inducing more single mothers to go to work as the changes in the 1996 welfare law. (The EITC and the welfare changes reinforced each other in this respect.) The research similarly finds that the EITC likely contributed as much to the decline in cash welfare receipt among female-headed families as did time limits and other welfare reforms.[4]
In addition, in the past few years, a growing body of research has found that the EITC and related types of assistance can have sizeable positive long-term effects on children such as improvements in educational success, health status, and future labor-market outcomes. The research finds that programs that supplement the earnings of low-income working families, like the EITC and the low-income component of the Child Tax Credit, boost children’s school achievement and are associated with increased work and earnings in adulthood. Economists Raj Chetty and John N. Friedman of Harvard University and Jonah Rockoff of Columbia University analyzed school data for grades 3-8 from a large urban school district and found that additional income from the EITC and CTC led to significant increases in students’ test scores.[5] Economists Gordon B. Dahl of the University of California, San Diego and Lance Lochner of the University of Western Ontario similarly found, after studying nearly two decades of data on mothers and their children, that additional income from the EITC significantly raises students’ math and reading test scores.[6]
Costs of Means-Tested Programs Other Than Health Care Will Decline Over the Coming Decade, and Fall Back to Historical Average, as a Share of GDP
Historical data on government spending and the new CBO projections enable us to examine cost trends for means-tested programs outside health care. The data are illuminating. In fiscal year 2011, total federal expenditures for means-tested entitlement (or mandatory) programs outside health care equaled 2.0 percent of GDP, which was about 50 percent higher than the average for the prior 40 years. But the recent increases were driven largely by the economic downturn and temporary program expansions under the Recovery Act. The CBO projections show that total expenditures for means-tested entitlements outside health care will decline steadily as a share of the economy as the economy recovers, and will fall to 1.3 percent of GDP by 2020 and thereafter. (These figures include outlays for refundable tax credits.)
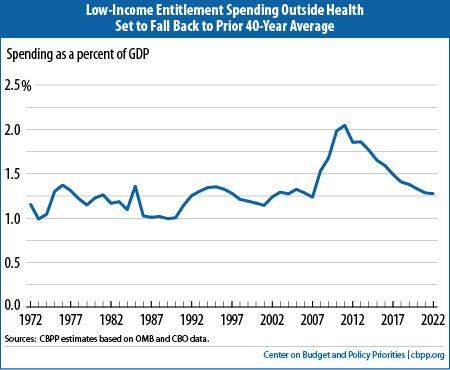
In other words, by 2020, means-tested entitlement expenditures outside health care, measured as a share of GDP, will return to their prior 40-year average. And these figures do not include low-income discretionary programs, which are virtually certain to decline as a share of GDP under the Budget Control Act caps. (Total non-defense discretionary spending will fall under the BCA caps to its lowest level, as a share of GDP, since 1962, so a decline in low-income discretionary programs is virtually inevitable.) As a result, total expenditures on low-income (or means-tested) programs outside health care, including both mandatory and discretionary programs, are expected to decline over the coming decade to a level belowtheir average over the prior 40-year period.
Costs for health care programs, in contrast, are rising as a share of GDP. But this is a reflection, especially in the case of Medicaid, of rising health care cuts throughout the U.S. health care system and the aging of the Medicaid beneficiary population. Medicaid already is lean, providing health coverage at a significantly lower cost than private insurance. The data show it costs about 27 percent less per child and 20 percent less per non-elderly adult than private coverage. Most budget proposals that would secure more than a modest amount of Medicaid savings would do by shifting costs to states. If that occurs, however, state policymakers are likely to cut benefits and provider payments and hence reduce patients’ access to care. In recent years, as states faced severe recession-induced budget crunches, many scoured Medicaid for savings and imposed painful cuts, including eliminating dental or vision care for various beneficiaries, restricting personal care for some people who are frail or disabled, and restricting access to nursing homes and other long-term services. States also cut provider payments, which already are well below what private insurance and Medicare pay.
The research suggests that the beneficial effects of the EITC and CTC follow children into adulthood. Harvard's Chetty and his co-authors report evidence that test score gains can lead to significant improvements in students’ later earnings and employment rates when they become adults.[7] Their findings are consistent with other research that followed poor children from early childhood into their adult years and found that significant increases in the incomes of these children’s families are associated with some enduring beneficial effects. The researchers found that each additional $3,000 in annual income in early childhood, whether from earnings or government assistance, was associated with more hours of work and an additional 17 percent in annual earnings in young adulthood.[8]
One final point related to refundable tax credits bears noting. The minimum wage has been allowed to erode over recent decades and is now more than 20 percent lower, after adjusting for inflation, than in the late 1960s. For this and other reasons, relating in part to globalization of the economy, wages for low-paid jobs in the United States have fallen. Partly in response, policymakers have expanded refundable tax credits for low-income working families with children, principally the EITC. These credits offset part of the wage decline for low-income working parents with children. Any consideration of the increases in federal costs in recent decades for refundable tax credits and other supports for low-income working families should be put in the context of what has happened to these workers’ wages.
3. Health Care Costs and an Aging Population Pose Longer-Term Challenge
The aging of the population and projected increases in per-capita health care costs, which are likely to rise faster than per-capita GDP, will put pressure on federal health and retirement programs, and on the budget in the decades ahead.
At the present time, there are major unknowns in the health area. The growth of both public and private health costs has slowed appreciably in the past few years. Spending for Medicare grew by only 3.2 percent in fiscal year 2012, CBO has reported, compared to an average of 6.7 percent a year from 2007 through 2011. Moreover, Medicare spending per beneficiary rose only 0.4 percent in 2012.
In Designing Medicare Changes, Policymakers Should Consider Effects
On Beneficiaries with Modest Incomes
When designing changes in Medicare, and in Social Security as well, policymakers should consider the circumstances of beneficiaries with very modest incomes. People sometimes think of affluent seniors playing golf and receiving benefits from these programs. To be sure, some beneficiaries are affluent and can afford to pay somewhat higher Medicare premiums or receive somewhat less from Social Security. However, half of all Social Security and Medicare beneficiaries have income (including their spouse’s income) of less than about $25,000 a year.
It’s often also assumed that people who are elderly or disabled face little in the way of out-of-pocket health costs because they are covered by Medicare (or jointly by Medicare and Medicaid, Medigap, or other supplemental insurance). Yet data from the Kaiser Family Foundation show that while U.S. households who are not receiving Medicare spend an average of 5 percent of their budgets on out-of-pocket health costs, Medicare households as a whole spend an average of 15 percent of their budgets on such costs. And, near-poor Medicare beneficiaries — those with incomes between 100 percent and 200 percent of the poverty line — or between $11,500 and $23,000 for an elderly or disabled individual — spend an average of 23 percent of their modest incomes on out-of-pocket health costs.
Changes affecting Medicare and Social Security beneficiaries should therefore be designed carefully to avoid causing hardship or impeding access to needed health care among people with modest incomes. The Social Security checks that beneficiaries receive equal their Social Security benefits minus their Medicare premiums, which are deducted from the checks. The premiums increase with health care costs, which tend to rise faster than general inflation, which erodes the purchasing power of Social Security checks over time.
The nation would not be well served if, for example, elderly widows trying to live on $15,000 a year in Social Security are unable to afford to see a doctor because we have set their Medicare deductible too high and they can’t afford to pay it out of their Social Security check. These are the types of matters that will require considerable attention to detail in the design of deficit reduction measures.
CBO’s latest projections of Medicare spending over the 2011-2020 period under current policy are more than $500 billion below the projections CBO made just two years ago, a significant improvement.
Experts do not yet know whether this slowdown is ongoing, at least in part — and will generate more savings than CBO has projected for future years and decades, as a growing number of experts now believe likely — or is strictly temporary. The answer will affect the magnitude of the nation’s long-term fiscal problem and the scope of the future changes that will be needed to further slow health care cost growth.
Most important, we currently lack needed information on how to slow health cost growth appreciably without reducing health care quality or impeding access to necessary care. Demonstration projects and other experiments to find ways to do so are starting, some of them government-funded and others entirely private-sector efforts. By later in the decade, we should have substantially more knowledge of what works and what doesn’t, and whether substantial changes are already occurring in health care delivery that are slowing cost growth and can be built upon and spread. Taking major policy action in this area — beyond the few hundred billion dollars in potential Medicare savings referred to earlier — before we have the necessary knowledge and experience could produce problematic results — it could fail to restrain health care cost growth, compromise health care quality, or harm substantial numbers of sick or otherwise vulnerable individuals. This isn’t an argument for taking no action, but rather for acting now to stabilize the debt for the coming decade, knowing that we’ll need to come back and do more for the longer run. Stabilizing the debt would buy us time to find answers to these very important health care questions.
4. Taxes or Spending?
Some policymakers argue that all further deficit reduction should come from spending cuts. Others argue it should come from a mix of spending cuts and revenue increases.
Can this difference be overcome? Martin Feldstein, former chief economic adviser to President Reagan, has written that there is a great deal of government spending that is embedded in the tax code. Feldstein suggests that deficit reduction could be achieved through reductions both in spending in the tax code and in spending on the outlay side of the budget.
Writing in the Wall Street Journal last week, Feldstein observed: “Republicans want to reduce the deficit by cutting government spending while Democrats insist that raising revenue must be part of the solution. Yet the distinction between spending cuts and revenue increases breaks down if one considers tax expenditures. Here are some examples. If I buy a solar panel for my house, a hybrid car, or an energy-efficient refrigerator, the government pays me. But instead of sending me a check, it gives me a tax credit or a tax deduction. There are dozens of such examples that increase the annual budget deficit by billions of dollars. Congress should review these tax expenditures and eliminate those that the country cannot afford.”
Feldstein wrote earlier that tax expenditures are the single largest source of wasteful and low-priority spending in the federal budget and one of the first places policymakers should go to restrain spending.
CBO director Douglas Elmendorf made a similar analytic point earlier this month at the House Budget Committee. In response to a question, Elmendorf explained:
“And I think that many economists agree that [tax expenditures] are really best viewed as a form of government spending because they are directed at particular people or entities or designed to subsidize particular activities, very much analogous to the way that government spending is often directed at particular people or entities or designed to subsidize particular activities.
So it is essentially a large component of spending by the federal government even though it is recorded essentially as lost revenue on the revenue side of the budget.”
That policymakers should look together at tax and spending entitlements can be illustrated by examining the subsidies that the federal government provides for child care costs. A parent with low or moderate income may be able to obtain a subsidy to help defray child care costs, with the subsidy being provided through a government spending program. A parent higher on the income scale also can receive a government subsidy that reduces her child care costs, but this parent’s subsidy is delivered through the tax code, via a tax credit or an exclusion from income.
It would not be sound policy for policymakers to put the tax-code subsidies off limits for deficit reduction while making the program subsidies a target for deficit reduction, because one type of subsidy is delivered through a “spending” program and the other is delivered through the tax code.
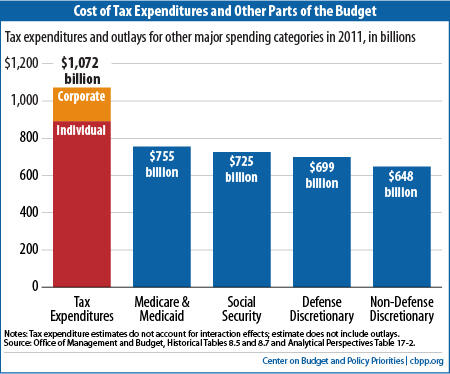
This isn’t a small matter. The federal income tax code includes about $1.1 trillion a year in tax expenditures. As Mr. Elmendorf noted in House Budget Committee testimony earlier this month, the cost of tax expenditures exceeds the cost of Medicare (which was $480 billion in 2011), Social Security ($725 billion) and defense ($699 billion). In fact, it substantially exceeds the cost of Medicare and Medicaid combined ($755 billion). It also far exceeds the total spending on of non-defense discretionary programs, which stood at $648 billion in 2011.
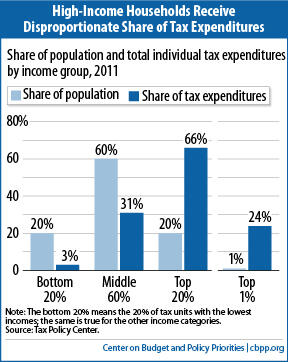
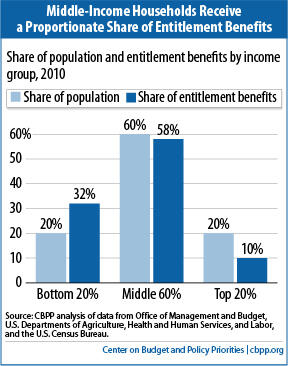
With tax entitlements, however, the situation is different. The Urban Institute-Brookings Institution Tax Policy Center has estimated that for tax year 2011, the top fifth of the population received 66 percent of all individual tax-expenditure benefits, with the top 1 percent of households receiving 24 percent of those benefits. The middle 60 percent of the population received just a little over 31 percent of the benefits. The bottom 20 percent of the population received 2.8 percent of the benefits.
If policymakers want to achieve deficit reduction that doesn’t further widen inequality or overly burden middle- and low-income households, and if they want to achieve deficit reduction in an economically efficient way, they will need to look at spending throughout the entire budget — in the tax code as well as on the outlay side of the ledger.
End Notes
[1] In calculating that another $1.5 trillion in deficit savings would stabilize the debt over the latter years of the decade at 73 percent of GDP, we start with the budget baseline that CBO has just released. We use CBO’s economic assumptions and make certain adjustments to its policy projections, which are identical to the adjustments that organizations such as the Committee for a Responsible Federal Budget also make. We freeze Medicare reimbursement rates for physicians at current levels, rather than assuming they will be slashed deeply. We phase down war funding over the next few years to a lower level, as policymakers are on course to do, rather than assuming that current levels of war costs continue (and rise with inflation) through 2023. We assume disaster funding will revert to the ten-year historical average level, as allowed by the Budget Control Act, rather than grow with inflation from the unusually high levels resulting from Hurricane Sandy. We assume that the scheduled sequestration cuts do not occur in 2013 or in the 2014-2021 period. We also assume that policymakers will continue certain improvements in refundable tax credits that they have just extended for five years. At the same time, we follow the CBO baseline in assuming that policymakers either will not continue a series of tax provisions often referred to as the “tax extenders,” which expire at the end of 2013, or will offset the costs of continuing those “extenders” they do maintain.
[2] Yonatan Ben-Shalom, Robert A. Moffitt, and John Karl Scholz “An Assessment of the Effectiveness of Anti-Poverty Programs in the United States,” NBER Working Paper 17042, May 2011.
[3] Stacy Dickert, Scott Houser, and John Karl Scholz, “The Earned Income Tax Credit and Transfer Programs: A Study of Labor Market and Program Participation,” Tax Policy and the Economy, Vol. 9, MIT Press, 1995. V. Joseph Holt, Charles H. Mullin, and John Karl Scholz, “Examining the Effect of the Earned Income Tax Credit on the Labor Market Participation of Families on Welfare,” NBER Working Paper No. 11968, January 2006.
[4] Jeffrey Grogger, “The Effects of Time Limits, the EITC, and Other Policy Changes on Welfare Use, Work, and Income among Female-Head Families,” Review of Economics and Statistics, May 2003. In separate study using different data, Grogger reaches similar conclusions. Jeffrey Grogger, “Welfare Transitions in the 1990s: the Economy, Welfare Policy, and the EITC,” NBER Working Paper No. 9472, January 2003, http://www.nber.org/papers/w9472.pdf.
[5] Chetty, Friedman, and Rockoff 2011.
[6] Gordon Dahl and Lance Lochner, “The Impact Of Family Income On Child Achievement: Evidence From The Earned Income Tax Credit,” American Economic Review (2012), 1927-1956, http://www.aeaweb.org/articles.php?doi=10.1257/aer.102.5.1927.
Building on Dahl and Lochner’s research methods, economists Alexander M. Gelber of the Wharton School of Business and Matthew C. Weinzierl of the Harvard Business School conclude that the income boost that low-income families with children receive from the EITC helps the tax system raise revenue more effectively. In essence, they conclude, when low-income families with young children receive additional income, their children perform better in school, which increases the opportunities that their children will have to succeed. Alexander M. Gelber and Matthew C. Weinzierl, “Equalizing Outcomes vs. Equalizing Opportunities: Optimal Taxation When Children's Abilities Depend On Parents' Resources,” NBER Working Paper No. 18332, August 2012, http://www.nber.org/papers/w18332.
[7] Raj Chetty, John N. Friedman, Nathaniel Hilger, Emmanuel Saez, Diane Whitmore Schanzenbach, and Danny Yagan, “How Does Your Kindergarten Classroom Affect Your Earnings? Evidence from Project Star,” The Quarterly Journal of Economics (2011), http://qje.oxfordjournals.org/content/126/4/1593.abstract.
[8] Greg J. Duncan, Kathleen M. Ziol-Guest, and Ariel Kalil, “Early-Childhood Poverty and Adult Attainment, Behavior, and Health,” Child Development (January/February 2010), pp. 306-325.) The $3,000 figure is in 2005 dollars, equivalent to approximately $3,530 in 2012.
[9] This figure subtracts premiums paid by beneficiaries and corrects for shifts in the timing of payments. Congressional Budget Office, Monthly Budget Review, Fiscal Year 2012, October 5, 2012, http://www.cbo.gov/sites/default/files/cbofiles/attachments/2012_09_MBR.pdf.
[10] Spending entitlement figures include the outlay components of the Earned Income Tax Credit and the Child Tax Credit. See Arloc Sherman, Robert Greenstein, and Kathy Ruffing, “Contrary to ‘Entitlement Society’ Rhetoric, Over Nine-Tenths of Entitlement Benefits Go to Elderly, Disabled, or Working Households,” Center on Budget and Policy Priorities, February 10, 2012, https://www.cbpp.org/cms/?fa=view&id=3677.