Program Spending Outside Social Security and Medicare Historically Low as a Percent of GDP and Projected to Fall Further
Total federal program spending — that is, spending excluding net interest payments on the debt— is projected to increase as a percent of the economy (gross domestic product or GDP) over the coming decade. This growth is due to the rise in Social Security and Medicare spending, resulting from the aging of the population and rising costs in the U.S. health care system. Outside Social Security and Medicare, the picture is very different. Taken as a whole, the remaining program expenditures — which account for nearly three-fifths of program spending this year and include Medicaid, the Affordable Care Act’s (ACA) coverage expansions, and spending on other low-income programs[1] — are at a historically low level as a percent of GDP and projected to decline further over the coming decade.
CBPP projects, based on Congressional Budget Office (CBO) forecasts (see the Appendix), that:
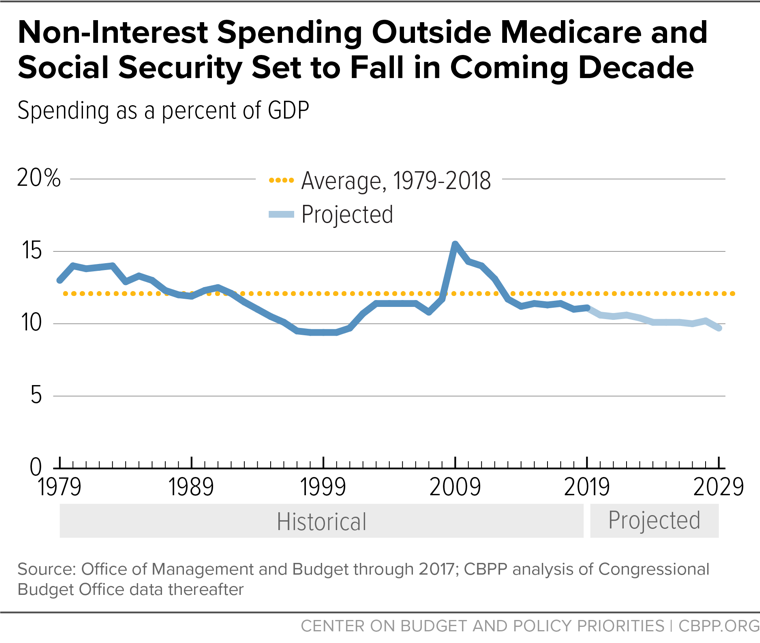
- Federal program spending outside Social Security and Medicare is below its 40-year historical average and will decline further under current policies. Total spending on federal programs outside Social Security and Medicare will equal 11.1 percent of GDP in 2019 — below the 40-year average of 11.9 percent — and is projected to decline further over the next ten years, to 9.7 percent of GDP in 2029. (See Table 1 and Figure 1.)
- The rise in Social Security and Medicare spending over time reflects an aging population and rising health care costs. Combined spending for these two programs is projected to rise from 7.9 percent of GDP in 2019 to 10.3 percent by 2029, well above the average over the past 40 years of 6.5 percent. The large majority of this growth reflects the aging of the population as the baby-boom generation retires. In addition, growing per-person costs in the nation’s health care system (in both the public and private sectors) — stemming in part from new treatments and medications that improve health and save lives but increase costs — continue to put upward pressure on Medicare costs.
| TABLE 1 | |||
|---|---|---|---|
|
Program Spending as Percent of Gross Domestic Product Under Current Policies |
|||
| Average 1979-2018 | 2019 | 2029 | |
| Non-interest spending | 18.4% | 19.0% | 20.1% |
| Excluding Social Security | 14.0% | 14.1% | 14.1% |
| Excluding Social Security and Medicare | 11.9% | 11.1% | 9.7% |
Total program spending, including Social Security and Medicare, will be 19.0 percent of GDP in 2019 — below the peak of 23.1 percent in 2009 (during the depths of the Great Recession) but above the 40-year historical average. Total program spending is projected to increase to 20.1 percent of GDP over the decade, reflecting the rise in Social Security and Medicare spending. Total federal spending, including interest payments, will equal 20.8 percent of GDP in 2019 and is expected to increase to 23.1 percent of GDP in 2029, reflecting the projected increase in net interest payments (from 1.8 percent of GDP to 3.0 percent). This increase in interest costs occurs primarily because the interest rates that the Treasury pays are expected to rise over the decade.
Some have portrayed the growth in program expenditures as an alarming trend, though it largely reflects the fact that more people will receive Social Security and Medicare as the population ages and that Medicare (and other health programs) will cost more due to factors like the aging of the baby boomers and improvements in medical technology. Outside of those demographic and health cost factors, the cost of government is projected to shrink relative to the economy under current policies. Policymakers would be wise to understand that, given these factors and rising national needs, total expenditures will likely need to exceed their historical average in coming decades. For the budget to be on a sustainable path, and to avoid damaging program cuts, higher levels of revenue will also be needed. These realities are reflected in a series of reports from bipartisan panels over the past decade, including a panel of the National Academy of Sciences and National Academy of Public Administration[2] and a Bipartisan Policy Center panel[3] chaired by former Senator Pete Domenici and former Congressional Budget Office (CBO) and Office of Management and Budget director Alice Rivlin, as well as in a report issued several years ago by analysts at the American Enterprise Institute.[4]
Demographics, Health Costs Drive Modest Rise in Total Program Spending
Federal program spending is expected to rise from 19.0 percent of GDP in 2019 to 20.1 percent in 2029. While these levels exceed the 18.4 percent average over the past 40 years (1979-2018), the higher levels reflect two key factors:
- The aging of the population as the baby boomers continue retiring. The share of the population aged 65 and over rose from 11.0 percent in 1979 to an estimated 15.9 percent in 2019 and will reach 19.5 percent in 2029.[5] Based on CBO estimates, we calculate that the aging of the population alone will account for about seven-eighths of the total increase in Social Security and Medicare spending as a percent of GDP between 2019 and 2029.[6] Indeed, if the population were not aging, total program spending as a percent of GDP would fall over the next decade.
- Rising per-person costs throughout the U.S. health care system. Health care costs per person are much higher today than in earlier decades and are expected to continue rising faster than GDP. While health care cost growth remains a major budget challenge, it has slowed noticeably in recent years.[7] Overall costs for federal health spending — including the costs of the ACA’s coverage expansions — are now significantly lower than CBO had projected at the start of the decade they would be without the ACA expansions.[8]
The projected growth in Social Security and Medicare does not reflect increases in the generosity of benefits. Benefits for both programs are generally modest. The average Social Security retirement benefit is $1,464 a month, or $17,568 a year, and benefits will replace a smaller portion of pre-retirement earnings in the future as Social Security’s “full retirement age” increases to 67.[9] With respect to Medicare, beneficiary households spend more than $5,000 a year on out-of-pocket health care costs, on average, which represents 14 percent of their budgets — over twice the share that non-Medicare households spend for health care, on average. [10]
Spending Outside Social Security and Medicare on Downward Path
The general spending picture changes substantially once one looks beyond Social Security and Medicare. [11]At 11.1 percent of GDP, program spending outside Social Security and Medicare is already below its 40-year average of 11.9 percent and is projected to fall to 9.7 percent of GDP in 2029. (See Table 1 and Figure 1.)
This decline reflects a substantial drop in annually appropriated, or “discretionary,” programs. These programs encompass almost all of national defense and a wide variety of other federal activities, including most federal support for transportation, education, natural resources, veterans’ health care, law enforcement, general government, and international programs. Expenditures for these programs are expected to fall from 6.3 percent of GDP in 2019 to 5.0 percent in 2029. In 2019, spending on these programs will be near the lowest level on record as a percent of GDP, with data going back to 1962, and will continue dropping each year thereafter.
Discretionary funding is limited by the 2011 Budget Control Act (BCA) caps, as further reduced starting in 2013 under “sequestration,” which was triggered by Congress’ failure to enact the additional deficit reduction that the BCA called for. Policymakers provided partial relief from sequestration from 2014-2017. In 2018, Congress passed a two-year budget deal permitting higher discretionary funding for 2018 and 2019 than in previous years, although still below the 2010 level adjusted for inflation.[12] But the BCA’s sequestration-level caps are scheduled to take full effect again in 2020 and 2021, pushing discretionary spending to historically low levels. As we’ve recently written, Congress should work this year to pass another budget deal in order to avert deep cuts in discretionary programs.[13]
Even if policymakers choose to continue the current level of discretionary funding for defense and non-defense programs, growing with inflation over the next decade — rather than to return to the lower levels required by the BCA caps — program spending outside Social Security and Medicare will still fall as a percent of GDP over the coming decade. Specifically, such expenditures would fall from their current 11.1 percent of GDP to 10.3 percent in 2029. While higher than the 2029 estimate of 9.7 percent shown in Table 1, this is still lower than the current level, which itself is below the 40-year average.
Spending on entitlement programs outside Social Security and Medicare is projected to remain steady over the next decade at roughly 4.9 percent of GDP. Importantly, this category includes Medicaid and health care subsidies provided under the ACA. It also includes military and civilian retirement, veterans’ compensation, refundable tax credits such as the Earned Income Tax Credit and Child Tax Credit, and key safety net programs such as SNAP (food stamps). CBO projects that the costs of the three largest means-tested income-support programs — the refundable tax credits, SNAP, and Supplemental Security Income — are all projected to decline over the next decade as a percent of GDP.[14]
Rising Interest Payments Will Add to Federal Spending
As noted, net interest payments are projected to rise from 1.8 percent of GDP in 2019 to 3.0 percent in 2029. Some two thirds of this increase reflects CBO’s assumption that Treasury interest rates on outstanding debt will rise as the Federal Reserve pushes rates up. The rest of the increase stems from a rising debt-to-GDP ratio, reflecting the mismatch between revenues and spending over the coming decade. It is worth remembering that higher deficits and debt result from both tax cuts and program expansions.
While policymakers can choose to raise or lower other spending, they cannot choose to pay more or less interest on the debt. Nor can they choose the interest rates Treasury must pay. They can affect interest costs only indirectly, as a byproduct of their decisions changing revenue and program spending levels. For these reasons, this analysis largely focuses on program spending and generally excludes interest payments.
Nation Still Faces Long-Term Budget Challenge
The bottom line is that the projected growth in federal program spending over the next decade as a percent of the economy is due to the effects on Social Security and Medicare of an aging population and rising per-person health costs. Outside these two programs, program spending is already below its historical average as a percent of GDP and will continue declining over the coming decade, despite the effect of rising per-person health care costs on Medicaid, veterans’ and military health programs, and federal subsidies to help people afford health insurance coverage.
This pattern — Social Security and Medicare growing faster than GDP, more than offsetting the shrinkage of other programs relative to GDP — will continue in subsequent decades. Projected revenue growth is insufficient to cover this net growth in program spending, so federal debt held by the public is also projected to grow more quickly than GDP. This is the long-term budget challenge; such a trend cannot continue forever.
The nation will need to address this fiscal challenge. In doing so, policymakers should accommodate spending and revenue levels somewhat higher than the historical 40-year averages to better reflect the circumstances the country faces in future decades (see box). But the portrait of an oversized federal government growing rapidly across the board is not accurate.
Historical Spending and Revenue Levels Not Adequate Guides for Future
This paper uses historical averages to help provide context for the analysis. But this approach should not imply that historical levels of spending — and revenue — should serve as a guide for the future, as some commentators suggest. Neither will be adequate to meet national needs in coming years.
The aging of the population and continuing increases in medical costs will necessitate higher levels of overall federal spending than over the past 40 years, even when programs outside Social Security and Medicare are shrinking relative to the economy. This, in turn, means that higher revenue will be needed to avoid drastic cuts in important programs.
An aging population and higher medical costs have already increased spending levels and will do so beyond the ten-year period this paper describes. The coming increase in the number of elderly people cannot be changed, and health care costs will likely continue to increase, despite ongoing efforts to achieve efficiencies. Due to these two factors alone, federal spending will need to be several percentage points higher in the future, relative to GDP, than it has been in the past. Between now and 2048, CBO estimates that the aging of the population alone will increase spending on Social Security and the major health care programs (including Medicare, Medicaid, and subsidies to purchase health coverage) by 3.3 percentage points of GDP.
In addition, interest payments on government debt are expected to rise in coming years, apart from the impact of any further deficits, as today’s low interest rates rise.
It is worth noting that historical levels of revenues were insufficient to match expenditures even when the population was younger and health care costs were lower.
- Between 1979 and 2018, federal revenues averaged 17.4 percent of GDP. Revenues at this level would not have balanced the budget in any of the last 40 years. Total outlays averaged 20.6 percent of GDP over this period.
- As a result of this mismatch between revenues and funding needs, deficits averaged 3.2 percent of GDP between 1979 and 2018 and debt generally grew faster than GDP.
Meeting rising national needs in coming decades while also placing the budget on a sustainable path over the long term will require both expenditures and revenues to be above their historical averages. When considering how to address the nation’s long-term fiscal challenges, policymakers thus should not use historical averages as a benchmark to guide their efforts. Rather, they should establish meaningful principles to ensure, for instance, that deficit-reduction policies are designed in ways that do not increase poverty or inequality, shortchange investments important for future economic growth (such as in infrastructure, basic research, and education and training), reduce health care coverage or quality, or harm the economy.*
*For more, see Paul N. Van de Water, “2017 Tax Law Heightens Need for More Revenues,” Center on Budget and Policy Priorities, November 15, 2018, https://www.cbpp.org/research/federal-tax/2017-tax-law-heightens-need-for-more-revenues.
Appendix: CBPP Budget Projections
This analysis is based on CBPP spending projections for the coming decade, which we calculate by starting with CBO’s January 2019 projections and then making the following two changes.
First, we remove certain timing anomalies from CBO’s projection. Some programs — e.g., Medicare Part C, Supplemental Security Income (SSI), and Veterans’ Compensation and Pensions — accelerate their monthly payments by a few days if the payments would otherwise fall on a weekend. And October 1, the start of the federal fiscal year, sometimes falls on a weekend. So in some fiscal years there are 11 or 13 “monthly” payments, distorting the year-to-year path of program expenditures,[15] deficits, and debt. We smooth the path by assuming 12 such payments each year. (See Appendix Figure 1.)
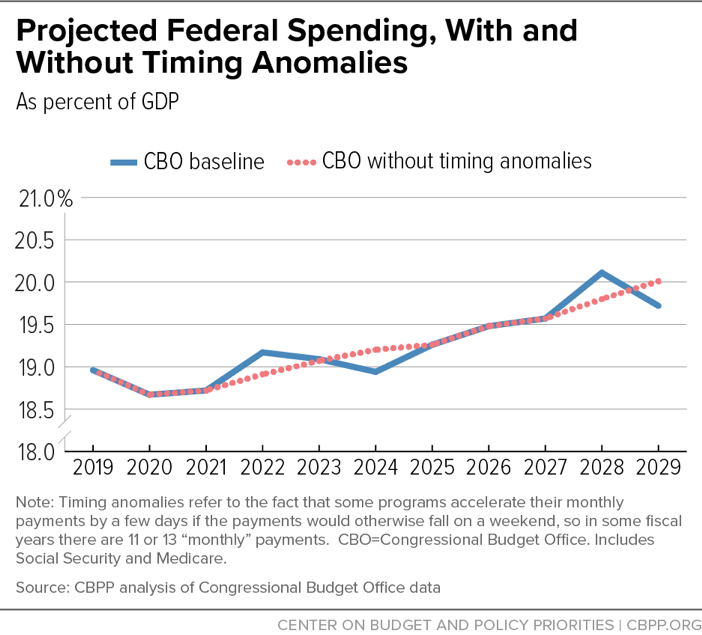
Fiscal year 2019 has 12 such “monthly” payments but 2029 has 11, so smoothing also makes the comparison between 2019 and 2029 expenditures, which we show in Table 1, more meaningful.
Second, CBO assumes that discretionary funding for natural disasters will grow with inflation each year, based on funding levels enacted in the current fiscal year. This can dramatically increase projections of discretionary spending if the current year has unusually high amounts of disaster funding, but more commonly it understates future disaster costs. In contrast to the mechanical approach that CBO is required to take, we calculate the statistically likely need for future disaster funding. This year, our approach to disaster funding deviates from CBO’s by less than one-tenth of a percent of GDP in 2029.
End Notes
[1] See also our companion piece: Richard Kogan and Yixuan Huang, “Low-Income Mandatory Programs Not to Blame for Long-Term Deficit Problem,” Center on Budget and Policy Priorities, updated March 9, 2019, https://www.cbpp.org/research/federal-budget/low-income-mandatory-programs-not-to-blame-for-long-term-deficit-problem.
[2] National Research Council and National Academy of Public Administration, “Choosing the Nation’s Fiscal Future,” National Academies Press, February 11, 2010.
[3] Bipartisan Policy Center, “A Bipartisan Approach to America’s Fiscal Future,” May 2015, http://pgpf.org/sites/default/files/05122015_solutionsinitiative3_bpc.pdf.
[4] Joseph Antos et al., “A Balanced Plan for Fiscal Stability and Economic Growth,” American Enterprise Institute, May 12, 2015, https://www.pgpf.org/sites/default/files/05122015_solutionsinitiative3_aei.pdf
[5] Based on population assumptions in the 2018 Social Security trustees report.
[6] Population aging will raise Social Security and Medicare spending by roughly 2.0 percentage points of GDP over the next decade. This estimate assumes that all of the growth in Social Security spending as a percent of GDP from 2019 to 2029, and roughly 80 percent of the growth in Medicare spending as a percent of GDP over that period, are due to the aging of the population. The Medicare figure constitutes all growth except that caused by “excess health care costs growth,” which CBO defines as the extent to which the growth rate of nominal health care spending per capita — adjusted for the demographic characteristics of the Medicare population — exceeds the growth rate of potential GDP per capita; CBO estimates it to be about 1.0 percent per year over the decade. (See pages 14 and 49 of CBO’s 2018 long-term budget outlook, https://www.cbo.gov/publication/53919.) Our division of all Social Security and Medicare cost growth as a percent of GDP closely follows the approach taken by CBO.
[7] Health care cost growth slowed to historically low annual rates during the recession and recovery. According to the National Health Expenditure projections from the Office of the Actuary at the Centers for Medicare & Medicaid Services, health spending growth will tick up slightly in the next few years but remain well below pre-recession growth rates. Gigi A. Cuckler et al., “National Health Expenditure Projections: 2017-26: Despite Uncertainty, Fundamentals Primarily Drive Spending Growth,” Health Affairs, March 2018, https://www.healthaffairs.org/doi/pdf/10.1377/hlthaff.2017.1655.
[8] Paul N. Van de Water, “Projected Health Spending Falling – Even with ACA’s Coverage Expansion,” Center on Budget and Policy Priorities, February 13, 2017, https://www.cbpp.org/blog/projected-health-spending-falling-even-with-acas-coverage-expansions.
[9] Social Security Administration, Office of the Chief Actuary, “Benefits Paid By Type Of Beneficiary,” using data for January 2019, https://www.ssa.gov/oact/ProgData/icp.html.
[10] Kaiser Family Foundation, “The Financial Burden of Health Care Spending: Larger for Medicare Households than for Non-Medicare Households,” March 2018, https://www.kff.org/medicare/issue-brief/the-financial-burden-of-health- care-spending-larger-for-medicare-households-than-for-non-medicare-households/.
[11] Figures for Social Security and Medicare spending in this analysis do not include administrative costs, which are included as part of “other spending.” Those administrative costs total less than one-tenth of 1 percent of GDP.
[12] David Reich, “Non-Defense Discretionary Funding Under Bipartisan Deal Yet Remains Below Earlier Levels,” Center on Budget and Policy Priorities, February 7, 2018, https://www.cbpp.org/blog/non-defense-discretionary-funding-increases-under-bipartisan-deal-yet-remains-below-earlier.
[13] Sharon Parrott, Richard Kogan, and Roderick Taylor, “New Budget Deal Needed to Avert Cuts, Invest in National Priorities,” Center on Budget and Policy Priorities, March 1, 2019, https://www.cbpp.org/research/federal-budget/new-budget-deal-needed-to-avert-cuts-invest-in-national-priorities.
[14] For instance, SNAP spending rose considerably during the Great Recession, leveled off in 2012 and 2013 as a percent of GDP, and started declining in 2014. CBO projects that, as the economy continues to recover, SNAP spending will fall to 1995 levels as a percent of the economy. And over the coming decade, CBO projects it will decline from 0.31 percent of GDP to 0.23 percent of GDP.
[15] Setting aside the timing shifts that exist under current law is akin to shifting program outlays by only a day or two, and thus does not materially alter the days on which the Treasury borrows to finance the expanding debt. For that reason, smoothing does not alter the payments of interest on the debt
More from the Authors