Testimony: Jared Bernstein, Senior Fellow Before the Senate Health, Education, Labor and Pension Committee United States Congress
Hearing on “Stories from the Kitchen Table: How Middle Class Families Are Struggling to Make Ends Meet”
Chairman Harkin and Ranking Member Enzi, I thank you for this opportunity to testify before this committee. There are few topics as important to America's economic success as the well-being of the broad middle class and I applaud this committee for once again bringing these issues to the forefront of your work.
I am currently a senior fellow at the Center on Budget and Policy Priorities.[1] Prior to my current position, I was chief economist to Vice-President Biden, as well as the executive director of the White House Taskforce on the Middle Class. Some of what I reference below derives from the activities of that taskforce.
The Middle-Class Squeeze and the Social Contract
It is commonly thought that the economic life of the American middle class has grown increasingly difficult over the past few decades. This sentiment has given rise to the notion of the "middle-class squeeze," which is generally understood to imply that middle-class families are having a harder time achieving a set of economic aspirations that we often associate with the American middle class.
These economic aspirations typically include a decent house in a good neighborhood with quality schools for their kids; the ability to save enough for their children's college education, as well as parents' belief that their kids should do as well or better than they did; the ability to afford decent health care coverage; working hard, but also finding enough time to actually enjoy their families; saving for their retirement.
It is also argued that for many years, there was an implicit social contract between government, private firms, and the middle-class. If folks "worked hard and played by the rules," they would have a good chance of realizing those aspirations. But in recent decades, both policy and structural economic changes, it is argued, have broken that contract with the middle class.
Some of these concepts are handily measurable. It is clearly the case, for example, that the cost of health care premiums has risen much faster than middle-class incomes and that the locus of risk of saving for retirement has shifted from employers and firms to workers and their families. It is also true that real median family income grew more slowly in recent decades than in earlier periods, and that this slowdown is particularly sharp relative to productivity growth.
But other aspects of this story are less amenable to empirical economic analysis. Economists have neither a widely accepted definition of "middle-class" nor a construct of a "middle-class squeeze." Certainly, there is no obvious metric for measuring the breaking of an implicit social contract, one that clearly didn't cover everyone (women, minorities) anyway.
Given those limits, this testimony evaluates the economic evidence for the middle-class squeeze where hard evidence exists. On other matters, like the broken social contract, I will, as best I can, extrapolate from the data and my experiences in this field of study to judge the claims being made.
The Empirical Evidence Behind the Middle-Class Squeeze
Median Family Income Growth:
I begin this section with an analysis of median family incomes, but before presenting these data, it is important to stress that the so-called "middle-class squeeze" did not begin with the Great Recession and it will not end when that downturn is fully behind us. As shown below, it is demonstrably the case that the Great Recession put even more downward pressure on the living standards of the middle class. But policy makers can neither understand nor address the problems documented herein if their analysis begins only a few years ago.
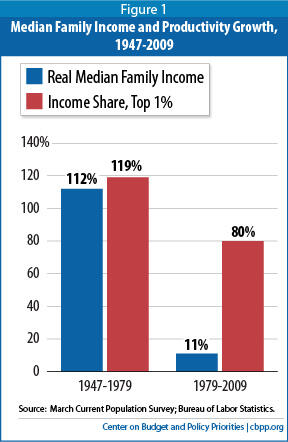
What explains these very different outcomes? First, they reflect the sharp increase in economic inequality since the 1970s. Yes, the productivity of the American economy downshifted over the past thirty years (though it accelerated post -1995) compared to prior decades, but it slowed much less than the growth of median family income. Clearly, a larger share of growth over this period flowed to those at the top of the income scale.
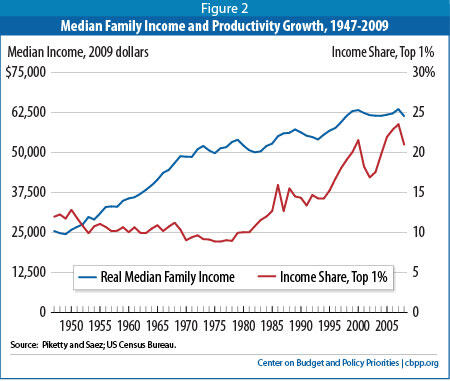
This fact is corroborated by a broad set of inequality statistics, including the much referenced work of economists Piketty and Saez (P/S). Figure 2 plots the time series of real median family income against the P/S data for the income share of the top 1 percent. The two trends broadly show that while real middle-income growth is not wholly "zero-sum" — i.e., a gain at the top does not necessarily come at the expense of the a loss in the middle — median incomes grew much more strongly during the period when income inequality was flat or falling.
Referencing once again the percent changes shown in Figure 1 above, median incomes more than doubled while the top 1 percent share fell by a couple of percentage points, 1947-79. Since then, when median family income grew by only 10 percent, the top one percent share grew by a striking 13.6 percentage points.
But the main point of this part of the analysis is that the post-1970s slowdown of real median family income growth is a) a key factor behind the middle class squeeze, and b) related to the increased inequality of income as the benefits of productivity growth eluded many in the middle class over the past few decades.
Work in the Paid Labor Market (Labor Supply):
The fact that family income growth slowed for many in the middle-class is not because they worked less. As is well-known, women's labor force participation grew significantly, almost doubling, over the period shown in the above figure, from about 32 percent in the late 1940s to almost 60 percent in recent years.
To get a closer look at what these changes mean to middle-class families, and how they might relate to the middle-class squeeze, we examined the annual hours worked in the paid labor market by middle income,[3] "prime-age" (25-54), husbands and wives with children, 1975-2009, along with low-income single mothers.
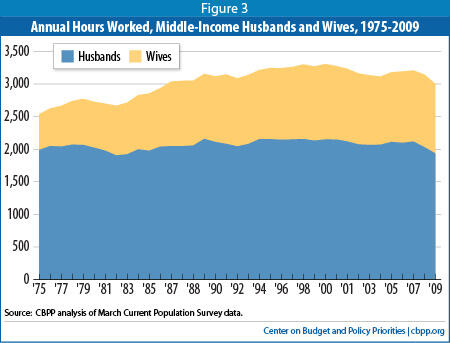
Figure 3 below shows annual hours of work by middle-income husbands and wives, 1975-2009. While middle income husbands in this age range generally worked full-time, full-year over this period, hours worked in the paid labor market by middle-income wives grew steeply, by over 400 hours, as shown in table 1.
The data shed light of the squeeze hypothesis in the following ways:
- Almost 100 percent of middle income husbands consistently worked full time, yet suffered stagnant hourly wages and thus overall earnings;
- Middle-income wives and single mothers significantly increased all dimensions of their labor market work, including participation, weeks per year, and hours per week;
- Their earnings also rose, though of course from a significantly lower base than men's earnings;
Certainly, the increased labor market work and better earnings opportunities for women represent an important societal advance. But as these are families with children, it also represents a stress factor in families' lives, contributing to another dimension of the squeeze; the challenge of balancing work and family life. Middle-income wives increased their participation by 11 percent, added nine weeks, on average, over these years, amounting to over 400 extra hours of working the paid labor market. That's about 2.5 months of full-time work, added to the family schedule.
And while wives' earnings clearly helped to offset husbands losses, if we add their earnings together in these two periods, their real income rises by about $6,000 over about 30 years, or about 0.5 percent per year.
There is another important point to consider regarding these data. As the figure above shows, middle-income wives hours have not grown since 2000, and in fact they fell by about 40 hours, 2000-07 (and further in the recession; see below). The same is true (not shown) for low-income single mothers, though even more so (about 80 hours lost). Research has not determined whether this is a "ceiling effect"—mothers have topped out on the amount of hours they can work given current family responsibilities and divisions of labor—or a function of weaker demand for the jobs and hours they'd like to work. But if more women, working more weeks per year and more hours per week at rising wages was a primary offset mechanism for stagnating men's wages, that route may not be as available to middle- and lower-income families going forward.
| TABLE 1: | ||||||
| Earnings | Hours | Share Work | Weeks per Year | Hours per Week | Hourly Wage | |
| Husbands | ||||||
| 1977-1979 | $36,150 | 2,059 | 95% | 49 | 44.3 | $17.56 |
| 2005-2007 | $35,343 | 2,109 | 96% | 50 | 44.0 | $16.76 |
| Change | -$807 | 50 | 1% | 1 | -0.3 | -$0.80 |
| Wives | ||||||
| 1977-79 | $6,050 | 666 | 56% | 36 | 33.1 | $9.07 |
| 2005-07 | $12,956 | 1,084 | 68% | 45 | 35.6 | $11.95 |
| Change | $6,906 | 418 | 12% | 9 | 2.5 | $2.9 |
| Single Mothers, Average of Bottom 60 Percent | ||||||
| 1977-79 | $14,017 | 1,115 | 70% | 40 | 37.3 | $12.58 |
| 2005-07 | $18,594 | 1,386 | 78% | 45 | 38.0 | $13.42 |
| Change | $4,577 | 271 | 8% | 5 | 0.7 | $0.85 |
| Notes: Data are from March CPS Surveys. Three-year averages were taken to smooth out volatility. Sample for husbands and wives, 25-54, parents of children under 18, middle-income fifth. Sample for single mothers same as above but data are for bottom 60 percent of families. Quintiles use cash income and have equal numbers of households. | ||||||
The Middle Class in the Great Recession
| Table 2: Middle Class Incomes in the Recession: Households Take a Hit (Median Household Income, 2009 Dollars) | |||||
| All | White | African-American | Hispanic | Asian | |
| 2007 | $51,965 | $53,912 | $35,086 | $40,013 | $68,382 |
| 2009 | $49,777 | $51,861 | $32,584 | $38,039 | $65,469 |
| Real Dollar Change | -$2,188 | -$2,051 | -$2,502 | -$1,974 | -$2,913 |
| Percentage Change | -4.2% | -3.8% | -7.1% | -4.9% | -4.3% |
| Source: U.S. Bureau of the Census | |||||
As noted, for many in the middle class struggling with the challenges raised thus far in this testimony, the recession that began officially in late 2007 represented a new problem on top of an old one. Income that was stagnant during the 2000s fell steeply when the economy turned down. As Table 2 reveals, households lost between $2,000 and $3,000 in real 2009 dollars in just two years (data for 2010 is not yet available).
For minority households, especially African-Americans, those losses came off of a lower base, so the percent decline — 7 percent — was historically large (the second largest two-year loss in a series going back to 1967).
We can also use our data series on middle-income, prime-age families in this context. As shown in Table 3, earnings and hours worked fell particularly steeply for middle-income husbands, who lost an average $3,600 and 184 annual hours of work, the equivalent of over one month of full-time work. Working wives did better than their husbands, but low-income single mothers also lost considerable ground, with a particularly sharp decline in their employment rates. This finding — why low-income single mothers lost more ground in the recession compared to middle-income wives — is worthy of further study. Putting aside child support, single mothers are by definition the sole breadwinners of their families, and these families are economically more vulnerable than most two-parent families.[4]
Other Dimensions of the Middle Class Squeeze
| Table 3: The Impact of the Great Recession on Middle- and Low-Income Families With Children | |||
| Annual Earnings | Hours | Share at Work | |
| Husbands | |||
| 2007 | $36,149 | 2,118 | 96.2% |
| 2009 | $32,529 | 1,934 | 93.9% |
| Change | -$3,620 | -184 | -2.3% |
| Wives | |||
| 2007 | $13,003 | 1,090 | 67.1% |
| 2009 | $12,944 | 1,066 | 67.4% |
| Change | -$59 | -24 | 0.3% |
| Single Mothers (Bottom 60%) | |||
| 2007 | $18,602 | 1,379 | 78.8% |
| 2009 | $17,157 | 1,279 | 74.2% |
| Change | $-1,445 | -100 | -4.6% |
| Notes: Data are from March CPS Surveys. Three-year averages were taken to smooth out volatility. Sample for husbands and wives, 25-54, parents of children under 18, middle-income fifth. Sample for single mothers same as above but data are for bottom 60% of families. | |||
In my work with Vice-President Biden on the White House Taskforce on the Middle Class, we heard middle-class families discuss the kinds of basic income and inequality problems documented thus far. We also heard a good deal about working harder yet getting ahead more slowly.
But more often than that, we heard the squeeze discussed in the context of how family budgets didn't seem to go as far as they used to, particularly in areas such as health care coverage and college tuition.
These concerns are supported by the data. For example, according to BLS price data, overall inflation has grown by a factor of three since the late 1970s; college tuition and fees, according to their price index has grown by a factor of 10. It is true that student aid has grown over this period as well, a very important development that I'll discuss in a policy section below.
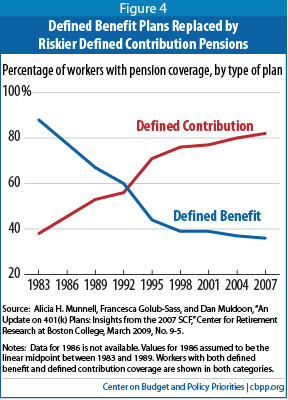
Retirement is also less secure for many older persons. One important factor here is the shift away from defined benefit pensions to defined contribution, a change that shifts the risk of income adequacy in retirement from employers to workers and their families. As figure 4 on page 7 reveals, there has been a complete reversal in share of coverage between a guaranteed and variable pension benefits.
Finally, the cost health coverage for middle class families is another source of the squeeze. Data from the Kaiser Family Foundation (KFF) show that the share of family coverage paid by covered workers has been relatively constant at about 27 to 30 percent. [5] But it is also the case that the cost of premiums has gone up much faster than middle-class earnings, meaning that families are paying a similar share of a larger amount. Census Bureau data show that median family income rose about 23 percent, not accounting for inflation, 1999-2009. According to KFF, the nominal premium costs of family coverage rose by 134 percent over this period. [6]
What Are the Policies That Could Help the Middle Class?
This committee has long been committed to tackling many of the policy challenges implied by the data and discussion above. Here, I briefly list a few policy areas that could make a difference. I offer few specifics and more generally just point out areas worthy of more policy research.
- Retirement Security : Social Security, a guaranteed pension for retirees, is often the first line of defense in retirement security. Though it is often mistakenly thought to be unimportant to most seniors, in fact, for recipients age 65 and up on, Social Security is about two-thirds of their income and that share grows with age—for the old-elderly, it's closer to 70 percent of their income. For a third of those over 65, Social Security accounts for at least 90 percent of their income.Image
So protecting Social Security benefits is a key component of a retirement security agenda. Beyond that, increasing access to pension savings through work would help future retirees. The Obama administration has put forth various proposals to encourage pension participation and incentivize employer participation. Also, with seniors living longer, presenting retirees with annuity options is also worth a close look.
- Health Care : The Affordable Care Act was clearly targeted at helping to improve middle-class health care security, by lowering the growth of health care spending and premium costs relative to their expected trend. Analysis by the President's Council of Economic Advisors that by lowering the growth rate of health care costs, the real income of middle class families in 2020 will be $2,600 higher than would otherwise be the case. [7]
In the near-term debate, however, it is very important to the middle class to protect the Medicaid program against deep spending cuts. Though Medicaid coverage is generally thought of as serving the low-income population, the program is the primary payer for 64 percent of nursing home residents. With savings and other insurance, middle-class seniors may be able to initially pay for home health or nursing home services, but over time many spend their savings and eventually need Medicaid to step in, as Medicare provides limited coverage for these services.
- Support for College Tuition: As noted above, college tuition has significantly outpaced inflation and middle-class income growth. But the large increase in government tuition assistance in recent years has helped offset these costs for both middle-class (American Opportunity Tax Credit) and lower-income students (Pell Grants). These measures can lower the net cost of tuition well below the "sticker price," and in doing so, help relieve income-strained families.
- Jobs and Incomes: The ability of middle-income families to meet the challenges noted thus far, from saving for retirement, balancing work and family, paying for college and health care, and retirement security, will all depend on quantity and quality of jobs available to middle-class families. While it is beyond the scope of this testimony to discuss a jobs agenda policy set, the ideas that President Obama outlined in his "winning the future" agenda, including investments in new industries such as clean energy, infrastructure, and education should certainly help generate more opportunities.
But there is much more for policy makers to consider in this area, including manufacturing policy (including aggressive pushback against unfair trade practices), a strong, efficient public sector, a balanced playing field for union organizing, appropriate workplace regulation to protect workers' safety and basic rights, decent minimum wage levels, and consumer protections.
These types of ideas have the potential to form the basis of a new social contract, one that could once again give the American middle class a fighting chance to loosen the squeeze and regain their economic footing.
End Notes
[1] I thank Arloc Sherman for the data work on the middle-class hours and earnings data. Hannah Shaw and Kelsey Merrick provided valuable research assistance. Any mistakes are my own.
[2] A technical issue raised here involves the different price deflators for family income, which uses a consumer price deflator, and for productivity, which uses a product-side deflator. Using a product deflator on family income closes 40 percent of the productivity/median-income gap, but when considering family well-being, it is notthe right approach, since families face consumer, not producer, prices. For example, it's true that machine tool prices are rising more slowly than health care prices, but it is that latter that matters to consumers.
[3] "Middle income" refers to household in the middle 20 percent of the distribution when households are ranked nationally by cash income.
[4] Low-income, married women (e.g., wives for quintiles one and two) had work and earnings patterns over the recession that looked more like middle income wives than like single mothers.
[5] See http://ehbs.kff.org/pdf/2010/8085.pdf, Exhibit 6.1.
[6] See http://ehbs.kff.org/pdf/2010/8085.pdf Exhibit 1.13
[7] See: http://www.whitehouse.gov/assets/documents/CEA_Health_Care_Report.pdf