Tax Foundation Figures Do Not Represent Typical Households’ Taxes
Figures May Mislead Policymakers, Journalists, and the Public
This report has been updated. Click here for the updated analysis.
Executive Summary
Each year, the Tax Foundation releases a report projecting “Tax Freedom Day,” which it describes as the day when Americans will have “earned enough money to pay this year’s tax obligations at the federal, state, and local levels.”[1]
The Tax Foundation’s “Tax Freedom Day” report is plagued by two major problems. First, its estimates of state and local tax obligations suffer from a number of serious methodological flaws (see the box on page 4). Second, over the years, many journalists and policymakers have misinterpreted the Tax Foundation’s report as reflecting the tax bills faced by typical middle-income workers.
In fact, the Tax Foundation’s calculation of the “average” tax bill merely measures tax revenues as a share of the economy; it is similar to estimates of total revenues as a share of Gross Domestic Product (GDP). In a progressive tax system like that of the United States, only upper-income households pay tax at rates equal to or exceeding the overall level of revenues as a share of the economy. Authoritative figures from the non-partisan Congressional Budget Office show that middle- and even upper-middle-income Americans pay a considerably smaller share of their income in taxes than the Tax Foundation report implies. The CBO data suggest that 80 percent of U.S. households pay federal tax at a lower rate than the Tax Foundation’s estimated “average” federal tax obligation.
The Tax Foundation itself acknowledges this issue in a methodology paper accompanying its report, pointing out that its estimates reflect the “average tax burden for the economy as a whole, rather than for specific subgroups of taxpayers.”[2] Journalists and others who report on “Tax Freedom Day” as if it represented the day until which the typical or average American must work to pay his or her taxes are misinterpreting these figures and inadvertently fostering misimpressions about the level of taxes most Americans pay.
Tax Foundation’s Federal Tax Rate Estimates Driven by High-Income Taxpayers
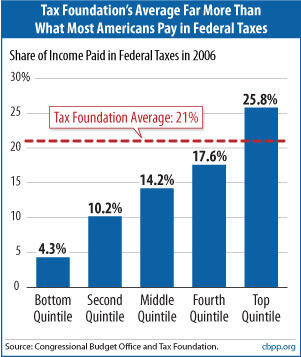
The Tax Foundation estimates that in 2006, the federal effective tax rate was 21 percent. But as Figure 1 shows, the Congressional Budget Office (CBO) estimates that households in each of the bottom four quintiles of the income scale paid less than 21 percent of their income in federal taxes in 2006. [4] (2006 is the most recent year for which the CBO data are available.) Only households in the top quintile paid a higher amount: 25.8 percent.[5] The CBO estimates suggest that roughly 80 percent of U.S. households pay a smaller share of their incomes in federal taxes than the overall federal effective tax rate. [6]
The Tax Foundation’s estimated effective federal tax rate for 2010 is noticeably lower than it was for 2005 —16.7 percent rather than 21 percent. Although we do not have data on federal effective tax rates in 2009 by quintile, we would expect decreases in the federal effective tax rates paid by each quintile, relative to the rates reported by CBO for 2006, so that the federal effective tax rate paid by each of the lower four quintiles would still be lower than the average federal effective tax rate for all taxpayers as calculated by the Tax Foundation. This is because the factors causing the lower effective rates — namely, the recession and the tax cuts in the American Recovery and Reinvestment Act (ARRA) — affect all income quintiles. In fact, the tax provisions in ARRA reduced federal effective tax rates more for taxpayers in the bottom quintiles than for those in the top quintile. [7]
The following example shows how the Tax Foundation’s methodology can overstate the tax burdens of the typical family. Suppose four families with incomes of $50,000 each pay $2,500 in taxes — 5 percent of their income — while one wealthy family with income of $300,000 pays $90,000 in taxes — 30 percent of its income. Total income among these five families is $500,000, and the total amount paid in taxes is $100,000. Thus, 20 percent of the total income of the five families goes to pay taxes. But the 20 percent figure is highly misleading as an indicator of the typical tax burden for families in this group.
Tax Foundation’s Average Figures Can Be Misleading
To be sure, an average figure like the one calculated by the Tax Foundation can yield useful information. Revenues measured as a share of the economy or as a share of national income is the most reliable metric for comparing revenue levels over time or across countries. The problem occurs when the tax burden figure that the Tax Foundation calculates is taken to represent the tax burden of the typical American worker.
For example, in 2006, the Wall Street Journal wrote, “The Tax Foundation reports that the average American works 116 days of the year to pay their tax bill (emphasis added).”[8] Similarly, senators Charles Grassley and Judd Gregg, drawing on the Tax Foundation’s report, wrote in a 2007 op-ed, “Americans must work an average of 77 days per year to pay their federal taxes. …” [9] Most people reading these articles would likely assume that the figures cited apply to the average or typical family. Yet that is not the case.
A Further Problem with “Tax Freedom Day”
The Tax Freedom Day concept also suffers from a deeper flaw. In its annual report, the Tax Foundation attempts to divide the year between days Americans spent working to pay federal, state, and local taxes and days they spent working for “themselves” so they can pay for goods such as food, clothing, housing, transportation, and medical care.
Tax Foundation’s State-by-State Data Are Seriously Flawed
The Tax Foundation’s proclamations of state Tax Freedom Days do not inform legitimate debates over levels of state and local taxes and the services those taxes support — and the report’s state-by-state estimates suffer from various flaws.*
- About two-thirds of the tax burdens in the Tax Foundation calculations are federal tax burdens. The amount of federal taxes paid by the residents of a state thus has a large impact on that state’s “Tax Freedom Day.” Since, as this analysis explains, the Tax Foundation methodology substantially overstates the federal tax burden of middle-class families, the Tax-Freedom-Day figures for each state also substantially exaggerate the tax burdens of middle-class families in that state.
- Because the federal income tax system is progressive, states with relatively wealthy residents end up under the Tax Foundation’s methodology with a higher federal tax burden than other states. The fact that one state has higher-income residents than another state has nothing to do with the level of state and local taxes in the state. Yet by trumpeting state-level Tax Freedom Days that differ across the states, the Tax Foundation presentation is likely to lead to the misimpression that differences in burdens imposed by state and local taxes account for the differences across states in the Tax Foundation’s “average tax burden,” when that often is not the case.
- The Tax Foundation uses a procedure to allocate state corporate, severance, and tourism taxes based on the residence of the consumers who purchase products that businesses sell (adjusted for taxes that tourists pay). This is likely to lead to further misimpressions about the role of a state’s tax policies on the tax burdens its residents are said to face. For example, when Alaska collects taxes from oil companies based on the amount of oil they produce in the state, the Tax Foundation does not count those taxes as part of Alaska’s revenue. Rather, it adds those taxes to the tax burden in the states where oil is consumed. Maine residents, for example, consume a significant amount of fuel and so get allocated a large share of these Alaska taxes. Yet state legislators in Maine cannot have much impact on the level of taxes that Alaska or other oil-producing states levy on oil.
Further, the Tax Foundation highlights the tax burden for the current calendar year, making its own estimates of the taxes that will be collected during the year in the thousands of state and local jurisdictions around the country. While presented as definitive, these estimates are, in fact, speculative projections that have often proven significantly off-target when the Census Bureau subsequently publishes actual data on state and local taxes. For example, the Tax Foundation’s 2002 report claimed that since 2000, tax burdens had risen in 38 states, fallen in five states, and not changed in seven states. When the Census Bureau released its data for 2002, it found that only four states’ tax burdens had risen, while tax burdens in 43 states had fallen (burdens were unchanged in three states).
In its reports, the Tax Foundation does not adequately acknowledge the possibility that its data may be erroneous. Nor does the Tax Foundation give prominent attention to the revisions it makes when its previous estimates prove to have been faulty.
As a result, the Tax Foundation’s proclamations of state Tax Freedom Days are misleading and do little to inform legitimate debates over levels of state and local taxes and the services those taxes support.
* See Nicholas Johnson, Iris Lav, and Joseph Llobrera, “Tax Foundation Estimates of State and Local Tax Burdens Are Not Reliable,” Center on Budget and Policy Priorities, March 27, 2007.
As the Tax Foundation itself acknowledged in its 2007 report, however, government revenues fund health and medical care for elderly and low-income Americans, as well as a significant fraction of the medical research that generates valuable health care innovations for Americans of all ages and income levels. Government revenues also fund Social Security payments that enable people who are elderly or have disabilities to pay for food, clothing, and housing.[10] Moreover, government revenues are needed to build and maintain the roads and bridges that families use every day. Government revenues also fund the educational system, justice system, and other basic infrastructure, without which many Americans would not be able to earn the incomes they do.
Of course, there are important debates to be had about the appropriate size of government. But these debates are not furthered by the Tax Foundation’s implication that Americans derive no benefit whatsoever from the goods and services government provides. Rather, these debates require careful consideration of the merits of trading public for private goods and services, recognizing that both can generate value for American households.
End Notes
[1] Kail M. Padgitt, “April 9th Is Tax Freedom Day,” Tax Foundation Special Report No. 177, March 2010.
[2] See Tax Foundation Staff, “Tax Freedom Day: A Description of Its Calculation and Answers to Some Methodological Questions,” Tax Foundation Working Paper No. 3, March 2008.
[3] As its measure of national income, the Tax Foundation uses Net National Product (NNP). In prior years, the Tax Foundation reported its estimates of the federal effective tax rate, but its most recent reports include only its estimates of total effective tax rates (including state and local taxes). However, its estimate of the federal effective tax rate for 2010 can be derived from its estimates of the total effective tax rate and the share of total tax receipts flowing to the federal government. Specifically, the Tax Foundation reports on page 8 of its analysis that the total effective tax rate for 2010 will be 26.9 percent. On page 6 it implies Americans will have to work 61 days to pay federal taxes and 99 days to pay all taxes. Multiplying that ratio (61/99) by the total effective tax rate (26.9 percent) yields a federal effective tax rate of 16.7 percent. Estimates for prior-year federal tax burdens are taken from the April 2006 Tax Freedom Day report, the most recent to include federal effective tax rates.
[4] The Tax Foundation’s estimates also differ from CBO’s in that the income measure the Tax Foundation uses (NNP) is different than CBO’s measure. However, CBO’s estimate of total federal taxes divided by total income is quite similar to the Tax Foundation’s: in 2006, 20.7 percent as compared with the Tax Foundation’s 21.0 percent.
[5] In 2006, a family of four needed income of more than $142,000 to be in the top income quintile.
[6] Of course, the figure for each quintile is an average for that segment of the population. Thus, some households, mostly in the fourth quintile, probably pay a larger share of their income in federal taxes than the Tax Foundation’s reported average. But many households in the top quintile likely pay less, since the top quintile average is pulled up by households at the very top of the income scale.
[7] Urban Institute-Brookings Institution Tax Policy Center.
[8] Tara Siegel Bernard, “Taxing Thought: All Pay to April 26 Goes to Uncle Sam,” Wall Street Journal, April 19, 2006.
[9] Charles Grassley and Judd Gregg, “Don’t Mess with Success,” Wall Street Journal, March 15, 2007.
[10] Ignoring this issue actually gives rise to a significant technical problem in the Tax Foundation’s report. In the pie charts on page 1, which compare the total effective tax rate with the share of total national income spent on food, clothing, and other purchases, government transfers to households — such as Social Security and Medicare — appear both in the tax slice and in the various categories of private consumption.
More from the Authors