Testimony: Robert Greenstein Executive Director, Center on Budget and Policy Priorities, on the Need to Implement a Balanced Approach to Addressing the Long-Term Budget Deficits
Before the Committee on Ways and Means, Subcommittee on Select Revenue Measures
I appreciate the invitation to appear before you today. I am Robert Greenstein, executive director of the Center on Budget and Policy Priorities, a nonprofit policy institute that conducts research and analysis on fiscal policy matters and an array of federal and state programs and policies.
My testimony today makes three major points:
- While current budget deficits are not themselves a problem — large deficits are needed in a deep economic downturn such as this one — our current fiscal path is simply unsustainable over the longer term. Federal deficits and debt will rise to unprecedented and dangerous levels if current policies remain unchanged.
- Digging ourselves out of this predicament will require action on both sides of the budget — spending and revenues. We will not be able either to finance the kind of government that Americans want with revenues near their historical level of 18 to 19 percent of gross domestic product (GDP) or to leave current programs unchanged.
- Congress should try to get deficits down to about 3 percent of GDP by mid-decade. Deficits at that level would keep the debt from rising as a share of the economy and thus would go a long way toward reassuring our creditors and putting the budget on a more sustainable path. Congress will face some crucial decisions in the months ahead that will have a large bearing on its ability to attain this goal.
Current Budget Policies Are Unsustainable
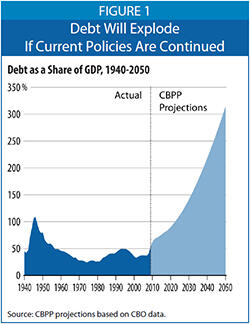
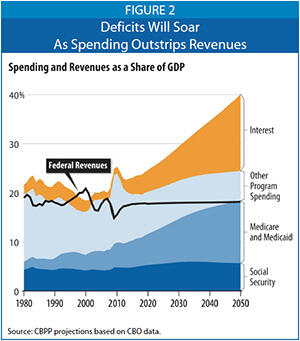
Deficits and debt are projected to grow this much because expenditures — largely driven by rising health care costs — will grow much faster than revenues between now and 2050. [2] Under current policies, we project that program expenditures (i.e., outlays for everything other than interest payments on the national debt) will increase from 19.2 percent of GDP in 2008 to 24.5 percent in 2050. We project that revenues will be at 18.2 percent of GDP in 2050, which is a bit below their average of 18.4 percent of GDP over the 30 years through 2008. (I would note that the federal budget was balanced only four times in those 30 years, and in all four of those years, revenues stood at 20 percent to 21 percent of GDP.)
One way of expressing the long-run budget challenge in a nutshell is by focusing on the “fiscal gap”— defined here as the average amount of program reductions or revenue increases that would be needed every year over the next four decades to stabilize the debt at its 2010 level as a share of the economy. That gap equals 4.9 percent of projected GDP. To eliminate the gap would require a 28 percent increase in tax revenues or a 22 percent reduction in program (non-interest) expenditures over the entire 40-year period from now to 2050 (or, more realistically, a combination of tax increases and spending cuts).
Although demographic changes — the aging of our population — account for part of this increase, rising health care costs per person are by far the biggest single factor over the long term. For the past 30 years, costs per person throughout the health care system — in both government programs and private-sector health care — have been growing approximately two percentage points faster per year than per-capita GDP. Our baseline projections assume that this pattern will continue through 2050. Over time, the fiscal consequences of this rate of growth in health costs are huge. [3]
Last year’s economic-recovery legislation is not responsible for the long-term fiscal problem; the recovery measures have added little to the long-term problem because they are temporary rather than ongoing.[4] Likewise, additional expenditures to support economic recovery of the magnitude that Congress is now considering would have only a tiny effect on the long-term picture.
Nor are federal spending programs other than the “big three” responsible for the long-term imbalance. Total spending for all federal programs other than Medicare, Medicaid, and Social Security is projected to shrink as a share of the economy in coming decades. These programs will consume a smaller share of the nation’s resources in 2050 than they do today. In particular, aggregate spending for entitlement programs other than the “big three” (such as federal civilian and military pensions, food stamps, supplemental security income, veterans’ benefits, family support payments, unemployment compensation, and the earned income tax credit) is expected to edge down as a share of GDP. These programs thus are not a cause of the long-term fiscal problem, and statements that we face a general “entitlement crisis” are incorrect.
In contrast, the 2001 and 2003 tax cuts are heavily implicated in our long-run fiscal problem. If policymakers were to allow these measures to expire on schedule at the end of 2010 — or to fully offset the cost of extending whatever portion of those tax cuts they chose to extend — that alone would shrink the fiscal gap by almost two-fifths, from 4.9 percent of GDP to 3.0 percent. Moreover, the cost of retaining and making permanent the tax cuts for people with incomes over $250,000 would be nearly as large over the next 75 years as the entire 75-year Social Security shortfall. [5] Let me hasten to add, however, that even if all of the 2001 and 2003 tax cuts were either allowed to expire or paid for, the budget would still be on an unsustainable long-term path.
Congress Needs to Tackle Both Spending and Revenues
The bottom line is that as the economy recovers, policymakers should begin to implement a balanced approach to addressing our long-term fiscal imbalance through a combination of sustained reforms of the U.S. health care system, reductions in federal expenditures, and increases in federal tax revenues.
The single most critical step is to slow the rate of growth in health-care spending. The health-care legislation that the House passed last weekend takes important first steps in that direction even as it expands coverage to an estimated 94 percent of those who reside legally in the United States. CBO judges that, in its second decade, the legislation (i.e., the combination of the Senate health bill and the new reconciliation bill) would reduce the deficit by about one-half percent of GDP — a significant amount. Over time, as we learn more about how to make health care delivery more efficient and to restrain health care cost growth without sacrificing health care quality, much more will need to be done.
Yet even if further major reforms are adopted, it is likely to prove impossible to hold health care expenditures to their current share of the economy. Older people have substantially higher health care costs than younger people do, and the population is aging. This means that expenditures for Medicare, Medicaid, and private-sector health care will necessarily rise even if the rate of growth in the cost of health care services is contained. In addition, although the U.S. health care system contains major inefficiencies that raise its costs, the rate of growth in those costs is largely fueled by advances in medical care and technology — and Americans almost certainly will want to take advantage of the medical breakthroughs that will occur in the decades ahead even if that progress carries a significant price tag. The historical record is clear that as people — and countries — grow more affluent, they tend to spend more of their incomes on health care in order to secure longer lives and better health that improves their quality of life.
Most experts consequently believe that although it will be possible — indeed will be absolutely essential — to reduce the rate of growth of per-capita health care costs to well below two percentage points per year faster than per-capita GDP, it is likely to prove impossible to slow growth so much that per-capita health care costs rise no faster than per-capita GDP. A society that both is older and has available to it the fruits of coming advances in medical technology will devote a bigger fraction of GDP to health care than we do today.
The Social Security challenge, by contrast, is manageable in size and straightforward to address through incremental, rather than fundamental, reforms. Social Security expenditures will grow substantially over the next two decades with the aging of the baby boomer population, but will then level off as demographic trends stabilize. Social Security costs are projected to be about one-fifth larger in 2050 than they are today, rising from 4.8 percent of GDP now to 6 percent of GDP in the mid-2030s and then subsiding slightly. Various government and non-governmental entities have laid out options for closing Social Security’s financing gap with revenue increases, benefit reductions, or more likely, some blend of both. [6]
In contrast, Medicare and Medicaid expenditures are projected to double as a share of GDP between now and 2035, and to continue rising inexorably even after that — not because of cost drivers peculiar to those programs but because of projected growth in health care costs systemwide. For more than 30 years the increase in costs per beneficiary in Medicare and Medicaid has mirrored the growth in costs per beneficiary in private-sector health care.
This means that the answer to the question of whether we can achieve fiscal sustainability wholly on the spending side is almost certainly “no.” That cannot be done without shredding the social safety net and eviscerating critical services and investments. Indeed, a recent analysis by a National Academy of Sciences (NAS) panel presented four paths to budget sustainability. We do not concur with the panel’s definition of sustainability; it aspires to a debt-to-GDP ratio of 60 percent (which implies deficits of about 2.3 percent of GDP), whereas we think that a 70 percent debt-to-GDP ratio (with deficits around 3 percent of GDP) is sustainable and much more realistic.[7] Nevertheless, the policies that the NAS panel outlined as part of the only one of its four illustrated paths that entails no revenue increases are striking. These policies include all of the following:
- Reducing the growth in costs per beneficiary in Medicare and Medicaid, beginning in 2012, all the way down to the rate of GDP growth. The panel noted this would entail going well beyond all of the measures that we know how to take to make health care more efficient. It thus would require cutting deeply into the basic health services that the programs provide to the elderly, the disabled, and the poor;
- Raising the Social Security retirement age and reducing the benefit formula for 70 percent of future retirees and trimming cost-of-living adjustments;
- Cutting all other spending — including defense, veterans, education, basic research, infrastructure, and assistance for people who are poor or vulnerable such as the frail elderly and people with severe disabilities — by 20 percent.
By enacting all of these policies, legislators could — in the NAS panel’s estimate — keep revenues at their historical levels of between 18 and 19 percent of GDP. But enactment of all of these policies is unimaginable. It is not something Americans would accept. It would turn ours into a coarse society in which people who are not affluent are essentially “hung out to dry.” Moreover, it likely would impair U.S. productivity growth over time as educational systems, infrastructure, and basic research suffered.
This leads to a basic conclusion that most experts have reached — namely, that higher taxes also must be on the table. As a result, unlike the last major round of tax reform in 1986, coming tax-reform efforts cannot be revenue-neutral. They must make a major contribution to long-term deficit reduction.
Tax Expenditures
As they did in 1986, lawmakers will need to take a hard look at tax expenditures, or what Alan Greenspan and other analysts have termed “tax entitlements.”[8] The Joint Committee on Taxation (JCT) prepares annual estimates of tax expenditures costs, and by summing the JCT estimates over the years (an admittedly rough practice[9]) the Congressional Research Service found that tax expenditures rose from less than 6 percent of GDP in 1974 to nearly 10 percent in 1987. Under the Tax Reform Act of 1986, tax expenditures initially fell back to 5.4 percent of GDP, but have since crept back up to 7.6 percent of GDP in 2007. In many budget areas (such as housing), the cost of tax expenditures dwarfs the budget outlays devoted to the same purpose. [10]
Moreover, many tax expenditures provide subsidies to individuals or corporations and, as the term “tax expenditure” implies, are essentially government spending delivered through the tax code. Policymakers and pundits often talk of “taxes” and “spending” as though they were quite distinct categories of the budget. In fact, with the spread of tax expenditures — the cost of which now exceeds $1 trillion a year, roughly equal to Medicare and Social Security combined — the distinction between “taxes” and “spending” has become increasingly suspect and often obscures more than it illuminates. Tax expenditures are distinct from “spending programs” in one very problematic way, however — they generally receive significantly less scrutiny.
Adding to these concerns, most individual tax expenditures take the form of deductions or exclusions rather than credits. This means that they provide the largest subsidies to people in the highest tax brackets, despite the fact that those are the people who generally need the subsidies the least and for whom the effectiveness of a subsidy in inducing the desired taxpayer behavior consequently often is the weakest.
Consider, for example, the situation in which a teacher and a banker both seek to purchase a home and take out a mortgage. Through itemized deductions, the government will defray 15 percent of the teacher’s mortgage interest costs and 35 percent of the banker’s. Yet the size of the deduction is, if anything, more likely to affect the teacher’s than the banker’s ability to buy a home. This is why many tax policy experts from across the political spectrum believe the current deduction structure is economically inefficient (as well as complex). Indeed, President George W. Bush’s Tax Reform Panel proposed turning the mortgage interest deduction into a uniform 15 percent tax credit.
Initial Steps Related to Tax Expenditures
To begin to address these inefficiencies in the tax code and to make progress on the nation’s fiscal problems, the President has proposed to limit the value of the deductions that individual taxpayers take to 28 percent (See Table 1). For the same-size mortgage, the banker referred to above would get a mortgage interest deduction worth about double the value of the deduction that the teacher could claim.
I support the President’s proposal but recognize that it goes beyond what the political system will bear, at least at this time. But I recommend that Congress adopt an approach this year of holding deductions to their current 35 percent top rate. Given the inefficient design of deductions and the nation’s alarming fiscal outlook, the value of deductions should not be increased to 39.6 percent for those in the top tax bracket when the top rate returns to 39.6 percent.
For more fundamental tax reform in this area in the years ahead, I urge policymakers to study an important paper co-authored in 2006 by Fred Goldberg, former IRS commissioner and Treasury Assistant Secretary under President George H.W. Bush, OMB Director Peter Orszag, and NYU tax law professor Lily Batchelder.[11] Their paper finds that in some crucial tax policy areas — such as providing incentives for retirement saving, college attendance, and the like — the current deduction structure is upside-down. The current structure loses massive amounts of revenue by over-subsidizing affluent individuals to take actions that, for the most part, they would have taken anyway, while providing too little financial incentive to change behavior among those who live paycheck to paycheck and for whom behavior-oriented tax incentives can have a larger effect. They recommend converting various deductions into flat-percentage refundable tax credits, in the interest of economic growth and efficiency, as well as of tax equity. As noted, some of the recommendations of President George W. Bush’s tax reform panel charted a similar course.
| Table 1: | |
| Proposed Policy | 10-year revenue raised (billions) |
| Limit the rate on itemized deductions to 28% | $291.2 |
| Reinstate the limit on itemized deductions (Pease) for taxpayers with income over $250,000 (married) or $200,000 (single) | $155.3 |
| Reform the US international tax system | $122.2 |
| Set 20% rate on capital gains and dividends for taxpayers with income over $250,000 (married) or $200,000 (single) | $105.4 |
| Repeal LIFO accounting methods | $59.0 |
| Eliminate tax breaks for oil and gas companies | $38.8 |
| Tax carried interest as ordinary income | $24.0 |
| Source: Obama FY2011 Budget | |
Corporate Taxes
Inefficiency also is rampant on the corporate side of the tax code. The U.S. corporate income tax has a high marginal rate but raises only modest amounts of revenue because the effective corporate tax rate — the percentage of profits actually paid in taxes — is much lower. As the Bush Treasury Department put it in a study on competitiveness in 2007: “the contrast between [the] high statutory CIT rate and low average corporate tax rate implies a relatively narrow corporate tax base, due to accelerated depreciation allowances, corporate tax preferences, and tax-planning incentives…” [12]
Because the corporate tax base is so narrow, there is room to reduce corporate preferences sufficiently to both reduce the top corporate marginal rate and help curtail unsustainable budget deficits. Claims that no more can be collected in overall corporate tax revenues without impairing competitiveness are not sound. While the marginal rates that U.S. corporations face are out of line with the marginal rates in most other western industrialized nations, the average effective tax rates that U.S. corporations face are not. Appropriate corporate tax reforms can improve economic efficiency and competitiveness and raise revenues at the same time.
Given how dramatically U.S. multinationals have shifted their profits abroad, international tax issues should be a central component of tax reform. As Rosanne Altshuler from the Tax Policy Center and Martin Sullivan of Tax Notes have noted, in just about a decade the share of drug company profits taken abroad has increased from one-third to four-fifths.[13]
Congress Should Take Concrete Steps Soon
Over the coming decade, policymakers should aim to get the deficit down to about 3 percent of GDP and then to hold deficits at that level (or below). This will require actions much larger than the biggest deficit-reduction efforts of the past — the Tax Equity and Fiscal Responsibility Act of 1982, the reconciliation acts that followed the “budget summits” between the Administration and congressional leaders in 1987 and 1990, and the reconciliation act of 1993.
The largest of those actions trimmed deficits by about 2 percent of GDP. Over the 2013-2020 period, we will need savings about one-and-a-half to two times as large. Accomplishing this at the same time that the baby boom generation — the huge cohort born between 1946 and 1964 — begins to retire in large numbers, and without the “peace dividend” that permitted reductions in defense spending in the 1990s, will be a daunting task.
These actions will likely need to be taken over in several steps over a number of years. But Congress faces some key immediate tests in the months ahead. If Congress fails these tests, the mid- and long-term deficit and debt problems will be substantially worse, and the ultimate threat to the economy even more serious.
Specifically, Congress needs, at a minimum, to allow the tax cuts for high-income households to expire on schedule and to hold the line on the 2009 estate-tax parameters. Both of these are steps President Obama has proposed.
If Congress extends the high-income tax cuts rather than allowing them to expire, this will add $826 billion to the debt over the coming decade (including the increased interest payments that will have to be made), and add even more to deficits and debt in the decades after that because of the compounding effects.[14] Tens of billions of dollars in further deficits and debt will be run up if the estate tax is weakened further, for example by raising the estate-tax exemption to $5 million (effectively $10 million per couple) and reducing the top estate tax rate to 35 percent. Such changes would benefit the estates of only the wealthiest one-quarter of 1 percent of Americans who die; the estates of the other 99.75 percent are already exempt under the 2009 estate-tax parameters. These changes would shrink the average effective tax rate on the relatively few estates subject to the tax, which stands at 18.9 percent under the 2009 parameters, to 14.3 percent. [15] Changes in the estate tax such as these would represent a windfall for the biggest estates; estates worth over $20 million would receive additional tax cuts that average $3.8 million per estate if the exemption is raised to $5 million and the estate tax rate cut to 35 percent. Such measures are difficult to fathom at a time when the nation faces crushing long-term deficits.
In considering these matters, lawmakers also should take note of the fact that incomes have surged in recent decades for households at the top of the income scale while stagnating for ordinary Americans. High-income households benefited from very large tax cuts at the same time that they were capturing the lion’s share of the increases in income that economic growth was generating.
During the most recent economic expansion (from the end of 2001 to the end of 2007), two-thirds of all of the gains in pre-tax income in the nation went to the 1 percent of Americans with the highest incomes. These households received massive tax cuts at the same time. [16] Internal Revenue Service data show that between 1995 and 2007, the percentage of income that households with incomes over $1 million paid in federal income taxes fell by nearly one-third, from 31.4 percent of income to 22.1. The effective income tax rate of the 400 Americans with the highest incomes — those with adjusted gross incomes of at least $139 million in 2007 — fell even more. This group paid an average of 29.9 percent of its income in federal income taxes in 1995, but paid 16.6 percent in 2007. [17] Their effective tax rate was cut nearly in half.
Given this context, returning to the top marginal rates that prevailed during the Clinton years — when high-income people thrived and the economy boomed — seems an eminently sensible first step in the face of the massive deficit and debt challenges we face.
The context regarding the estate tax is similar. Between 2001 and 2009, the amount of an estate’s value that is exempt from the tax rose from $675,000 to $3.5 million per person, and the number of estates paying any tax shrunk from 1 in 50 to 1 in 500. Under the 2009 rules, a wealthy couple with two children can leave each of their children $3.5 million tax free (on top of giving $26,000 tax free to each child each year while the couple is still alive). This $3.5 million alone is more than a middle-class family making $70,000 a year earns during a lifetime, and the middle-class family pays taxes on that income every year. Simply making the 2009 estate-tax parameters permanent will itself cost $305 billion over the next ten years. [18]
Balanced Approach to Deficit Reduction is Needed
As policymakers begin to grapple with the need for substantial mid-term and long-term deficit reduction, everything should be on the table. Both measures related to program expenditures and measures related to taxes will have to be part of the solution.
I would note that some measures can simultaneously restrain expenditures and enhance revenues. Most experts believe that the CPI slightly overstates inflation. To address this overstatement, the Bureau of Labor Statistics has developed an alternative CPI. On average, the alternative measure, referred to as the chained CPI, rises about three-tenths of a percentage point more slowly per year than the traditional CPI. Congress could adopt use of the chained CPI on both the expenditure and revenue sides of the budget.[19]
Such a step would likely be attacked by some as cutting Social Security benefits or raising taxes, but such attacks would be unwarranted. The intention of the Social Security Act and the Internal Revenue Code is to adjust for inflation, not to overadjust. This reform would meet those intentions.
This change would produce small savings initially. But the savings would grow over time and become significantly larger in the years when the fiscal problems we face will be very serious.
Finally, it should be recognized that while the largest savings ultimately will need to come from slowing the growth in health care costs and hence in the costs of Medicare and Medicaid, there are practical limits to the amount of additional deficit reduction that can be achieved in the health care programs — and in Social Security as well — over the coming decade. Changes that affect these programs’ beneficiaries will need to be phased in gradually in order to give people time to adjust. As an example, the increase in the Social Security retirement age enacted in 1983 did not start to take effect until 2000 and will not be fully phased in until 2022; this timetable has been crucial to public acceptance of the rise in the retirement age and to the lack of efforts to stop it from going into effect. Second, the current health reform legislation includes most of the measures that mainstream experts have identified as steps we know how to take now to slow the growth in health care costs. It will take time for the important demonstration and research projects contained in the health reform bill to yield information on how to achieve the substantial additional savings we will need without sacrificing health care quality.
These realities mean that further substantial revenue increases — as well as savings in low-priority programs — will have to be on the table if we are to have any chance of shaving deficits to 3 percent of GDP over the coming decade. Health care and Social Security should be able to yield a larger share of the needed savings over the long term than they can provide over the coming decade.
This heightens the importance of policymakers not being swayed by the dubious arguments that letting the upper-income tax cuts expire (and preserving the 2009 estate-tax rules) would derail the economic recovery. In fact, any resulting drop in consumption by upper-income people would be modest, as research shows that a large share of the tax cuts that go to people at the top of the income scale are saved rather than quickly spent. This is why the Congressional Budget Office, in a recent report evaluating the impact of about a dozen options for boosting the economy and creating jobs over the next two years, rated extending the high-income tax cuts dead last.[20]
The economy would better be served by allowing these tax cuts to expire on schedule and using the proceeds for a short initial period to finance temporary policies that CBO and other experts have found would be more effective in boosting the economy and creating or preserving jobs. For example, additional funds to support state and local governments are badly needed to forestall unprecedented state and local budget cuts in the next year or two that would place a strong drag on the economy and could jeopardize the recovery. A continuation of extended unemployment benefits and other targeted, carefully designed measures for a temporary period also would boost aggregate demand and thereby help to preserve or create jobs. Shifting resources from high-income tax cuts to such measures would strengthen the economy and create jobs in the short run. Once the economy has recovered, however, all of the proceeds from letting the high-income tax cuts expire should go for deficit reduction.
| APPENDIX TABLE 1: | |||||||||
| Social Security | Medicare | Medicaid | Other Program Outlays | Total Program Outlays | Revenues | Interest payments on the debt | Surplus (+) or Deficits (-) | Debt Held by the Public (End of Year) | |
| 2000 | 4.2% | 2.0% | 1.2% | 8.7% | 16.1% | 20.9% | 2.3% | +2.4% | 35% |
| 2010 | 4.8% | 3.1% | 2.0% | 14.1% | 23.9% | 15.6% | 1.4% | -9.7% | 62% |
| 2020 | 5.3% | 4.2% | 2.1% | 8.6% | 20.2% | 17.7% | 4.4% | -6.9% | 90% |
| 2030 | 5.9% | 6.2% | 2.6% | 7.8% | 22.5% | 18.0% | 7.0% | -11.5% | 141% |
| 2040 | 5.9% | 7.8% | 3.3% | 6.9% | 23.8% | 18.0% | 10.8% | -16.6% | 218% |
| 2050 | 5.7% | 8.9% | 3.9% | 6.0% | 24.5% | 18.2% | 15.6% | -21.9% | 314% |
| Source: CBPP calculations based on CBO data. | |||||||||
End Notes
[1] These estimates assume extension of the 2001 and 2003 tax cuts, extension of other expiring tax provisions (except for the explicitly temporary provisions of last year’s recovery act), continuation of relief from the Alternative Minimum Tax (AMT), cancellation of the deep cuts scheduled under current law in fees paid by Medicare to physicians, and gradually diminishing funding for operations in Iraq and Afghanistan as we wind down our operations there. For more information, see Kathy Ruffing, Kris Cox, and James Horney, “The Right Target: Stabilize the Federal Debt,” Center on Budget and Policy Priorities, January 12, 2010. These projections were done before CBO’s latest round of revisions, but they would not change materially if updated.
[2] Automatic stabilizers — safety net programs whose outlays rise during recessions — along with temporary expenditures needed to stabilize the financial system and provide additional stimulus to the economy caused program expenditures to surge to 24.9 percent of GDP in 2009. Expenditures are projected to remain elevated for several years while the economy recovers and then to decline for awhile before starting a steady rise as health care costs continue growing faster than the economy and the population ages.
[3] Rising costs throughout the health care system exacerbate the long-term budget problem in two ways. As is well known, they increase federal spending directly by raising the cost per beneficiary of providing health care through Medicare and Medicaid. Less well understood is that rising health costs worsen deficits even further by eroding the tax base. Because of tax preferences for employer-sponsored health coverage and certain other health care spending, when health care costs grow faster than the economy, the share of income that is exempt from taxation increases and the revenue base shrinks.
[4] See the box on page 6 of “The Right Target,” cited in footnote 1.
[5] Kathy A. Ruffing and Paul N. Van de Water, “What the 2009 Trustees’ Report Shows About Social Security,” Center on Budget and Policy Priorities, May 18, 2009, p. 4.
[6] See the Center for Retirement Research, The Social Security Fix-It Book (revised 2009 edition, online at www.bc.rrc.edu); National Academy of Social Insurance, Fixing Social Security: Adequate Benefits, Adequate Financing (October 2009, online at www.nasi.org); and the solvency options estimated by the Social Security Administration’s Office of the Chief Actuary at http://www.ssa.gov/OACT/solvency/provisions/index.html.
[7] In fact, the NAS panel based its budget projections on CBO’s March 2009 baseline. Because the budget outlook worsened as the year went on, the NAS paths almost certainly would no longer suffice to reach the panel’s 60 percent target.
[8] The Congressional Budget and Impoundment Control Act of 1974 officially defined tax expenditures as “those revenue losses attributable to provisions of the Federal tax laws which allow a special exclusion, exemption, or deduction from gross income or which provide a special credit, a preferential rate of tax, or a deferral of tax liability.”
[9] See Leonard E. Burman, Christopher Geissler, and Eric J. Toder, “How Big Are Total Individual Income Tax Expenditures, and Who Benefits from Them?” American Economic Review, papers and proceedings, vol. 98, no. 2 (May 2008),.
[10] Thomas L. Hungerford, “Tax Expenditures: Trends and Critiques,” Congressional Research Service, September 13, 2006; Thomas L. Hungerford, “Tax Expenditures and the Federal Budget,” Congressional Research Service, February 27, 2009.
[11] Lily L. Batchelder, Fred T. Goldberg, Jr., and Peter R. Orszag, “Reforming Tax Incentives into Uniform Refundable Tax Credits,” Brookings Institution Policy Brief #156, August 2006.
[12] US Department of the Treasury, “Treasury Conference on Business Taxation and Global Competitiveness: Background Paper,” July 23, 2007.
[13] Martin A. Sullivan, “Economic Analysis: Drug Company Profits Shift Out of United States,” Tax Notes, March 8, 2010; Rosanne Altshuler, “Where are the profits, and why?” TaxVox Blog, March 18, 2010, available at http://taxvox.taxpolicycenter.org/blog/_archives/2010/3/18/4483532.html
[14] CBPP calculations of savings over 2011-2020 based on OMB estimates from February 2010 ( http://www.whitehouse.gov/omb/budget/fy2011/assets/tables.pdf). President Obama’s proposals to allow high-income tax cuts to expire include allowing the top two marginal tax rates to revert to 36 and 39.6 percent, the proposed reinstatement of Pease and PEP, and a 20 percent tax rate on capital gains and dividends for the specified income group.
[15] Estimates are for estates in 2011. See Tax Policy Center “Estate Tax Projections and Distribution Tables,” http://www.taxpolicycenter.org/numbers/displayatab.cfm?template=simulation&SimID=322&relTTN=T09-0398.
[16] See Avi Feller and Chad Stone, “Top 1 Percent of Americans Reaped Two-Thirds of Income Gains in Last Economic Expansion,” September 9, 2009.
[17] See Avi Feller and Chuck Marr, “Tax Rate for Richest 400 Taxpayers Plummeted in Recent Decades, Even As Their Pre-Tax Incomes Skyrocketed,” February 23, 2010.
[18] CBPP calculation based on CBO’s March 2010 reestimate of the President’s budget; includes $52 billion in interest costs from increased borrowing.
[19] See Congressional Budget Office, “Using a Different Measure of Inflation for Indexing Federal Programs and the Tax Code (February 24, 2010) and Center on Budget and Policy Priorities, “Case for a Social Security Cost-of-Living Adjustment in 2010 is Weak” (October 15, 2009).
[20] Congressional Budget Office, “Policies for Increasing Economic Growth and Employment in 2010 and 2011” (January 2010) and related testimony by CBO Director Douglas Elmendorf before the Joint Economic Committee (February 23, 2010).