- Home
- Deficits, Debt, And Interest
Policy Basics: Deficits, Debt, and Interest
Three important budget concepts are deficits (or surpluses), debt, and interest. For any given year, the federal budget deficit is the amount of money the federal government spends minus the amount of revenue it takes in. The deficit drives the amount of money the government must borrow in any single year, while the national debt is the cumulative amount of money the government has borrowed throughout our nation’s history — the net amount of all government deficits and surpluses. The interest paid on this debt is the cost of government borrowing.
Deficits (or Surpluses)
For any given year, the federal budget deficit is the amount of money the federal government spends (also known as outlays) minus the amount of money it collects from taxes (also known as revenue). If the government collects more revenue than it spends in a given year, the result is a surplus rather than a deficit. The Congressional Budget Office (CBO) estimates that the fiscal year 2022 budget deficit will be around $1 trillion (3.9 percent of the economy as measured by gross domestic product, or GDP). That’s down significantly from the 9.8 percent it reached in the depths of the Great Recession and the 15 percent it reached in 2020, at the peak of the COVID-19 shutdown. But it is higher than its recent low point in 2015, of 2.4 percent of GDP.
When the economy is weak, people’s incomes decline, so the government collects less in tax revenue and spends more on economic security programs such as unemployment insurance or food assistance. This is one reason that deficits typically grow (or surpluses shrink) during recessions. Conversely, when the economy is strong, deficits tend to shrink (or surpluses grow).
Recessions aren’t the only causes of deficits. A government may also face a structural deficit, or one that exists even when the economy is operating at full capacity, with high employment.
Economists generally believe that increases in the deficit resulting from an economic downturn perform a beneficial “automatic stabilizing” role, helping moderate the downturn’s severity by cushioning the decline in overall consumer demand. They reduce the degree to which the public cuts back its own spending, thereby short-circuiting what could otherwise be a vicious circle: families spend less as their incomes stagnate or drop, so business profits shrink or turn to losses and businesses lay off some employees, who in turn must also cut back. In contrast, when the government runs structural deficits and borrows large amounts of money even in good economic times, that borrowing is more likely to have harmful effects on worldwide private credit markets and hurt economic growth over the long term.
Debt
Unlike the deficit, which drives the amount of money the government borrows in any single year, the debt is the cumulative amount of money the government has borrowed throughout our nation’s history. When the government runs a deficit, the debt increases; when the government runs a surplus, the debt shrinks.
Three measures of the debt are:
- Debt held by the public measures the government’s borrowing from the private sector (including banks and investors) and foreign governments. CBO estimates that at the end of fiscal year 2022 (September 30, 2022), debt held by the public will equal $24.2 trillion.
- Debt net of financial assets (or net debt) measures the debt held by the public minus offsetting financial assets held by the government, such as cash, gold, and the value (to the government) of the Treasury’s portfolio of loan assets — amounts that others have borrowed from the government but have not yet repaid, such as loans to college students. CBO estimates that net debt will be $21.7 trillion by the end of 2022.
- Gross debt is debt held by the public plus the securities the Treasury issues to U.S. government trust funds and other special government funds, such as the Federal Deposit Insurance Corporation — that is, money that one part of the government lends to another. CBO estimates that by the end of 2022, the gross debt will reach $30.6 trillion, with the U.S. government trust funds and other federal government accounts holding $6.4 trillion in Treasury securities. The trust funds with the largest balances are Social Security, Military Retirement, Civil Service Retirement, Medicare, and the Highway Trust Fund. The amounts held by such trust funds that are not needed to pay current costs are invested in Treasury bonds, and the Treasury uses those proceeds to help pay for government operations. As a result, the Treasury owes money to the Social Security and other trust funds and accounts and will repay it when those programs need the money to pay future benefits.
Debt held by the public is a far better measure of debt’s effect on the economy than gross debt because it reflects the demands that the government is placing on private credit markets. (When the Treasury issues bonds to Social Security and other government trust and special funds, by contrast, that internal transaction does not affect the credit markets.) Further, the debt held by the public is a better measure of the government’s net financial position; although the amounts the Treasury borrows from government trust and special funds are real liabilities of the Treasury, they are also real assets of the government trust and special funds.
For the same reasons, debt net of financial assets, or net debt, is an even better measure of the government’s financial position and its effect on the economy. While money the government borrows is a liability of the government, money it lends is an asset that offsets some of that borrowing (but only to the extent it is expected to be repaid). The financial position of the federal government, like that of families and businesses, is best measured by counting both financial assets and liabilities, not just liabilities. In addition, this measure of debt most closely grows or shrinks with annual deficits or surpluses.
Debt held by the public and net debt tracked each other fairly closely until 2008, when the volume of loans provided by the federal government, particularly for higher education, increased significantly. Nevertheless, net debt and debt held by the public continue to show similar trends, and most economists and budget analysts continue to use debt held by the public in their public analyses.
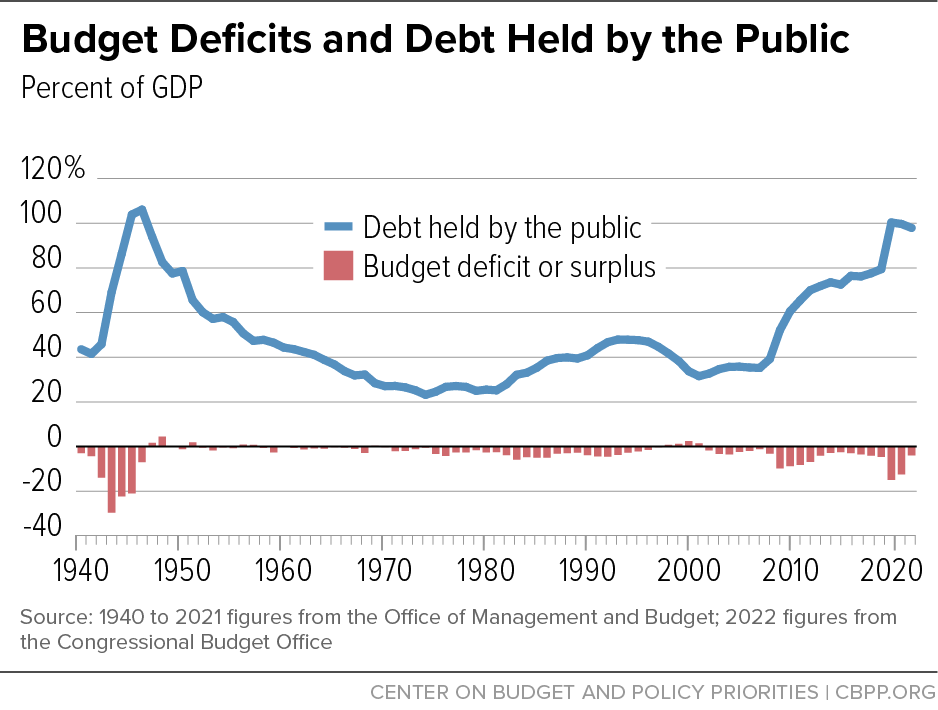
Figure 1 shows deficits and debt held by the public relative to the size of the economy (as measured by GDP). The budget does not have to be balanced to reduce the significance of the debt. For example, even though there were deficits in almost every year from the end of World War II through the mid-1970s, debt grew much more slowly than the economy, so the debt-to-GDP ratio fell dramatically.
Debt held by the public was 79 percent of GDP in 2019 — a ratio more than double what it was in 2007, with the jump largely due to the Great Recession and efforts to mitigate its impact. And the debt ratio jumped again, to 100 percent of GDP by the end of 2020, because of the sudden and steep recession caused by the pandemic and the very significant efforts to fight its effects. While currently shrinking, recent projections show the debt ratio starting to rise again by the middle of the decade, reaching 110 percent of GDP by 2032 and likely continuing to rise over the subsequent decades as well. That’s largely due to the aging of the population and increases in health and interest costs, which will cause spending to grow faster than GDP, while revenues generally grow proportionally to GDP. In short, projections show an underlying structural deficit sufficiently large that it causes debt to grow somewhat faster than the economy.
Researchers have not found any threshold above which debt dramatically slows economic growth. But a debt ratio that is high by historical standards has led some policymakers and analysts to call for more deficit reduction in order to lower it. Reducing deficits while the economy is weak is harmful, but economists generally believe that the debt ratio should be stable or declining when the economy is strong.
Interest
Interest, the fee a lender charges a borrower for the use of the lender’s money, is the budgetary cost of government debt. Interest costs are determined by both the level of net debt — the amount of money borrowed (also known as the principal) — and the interest rate. When interest rates rise or fall, interest costs generally follow, making the debt a bigger or smaller drain on the budget.
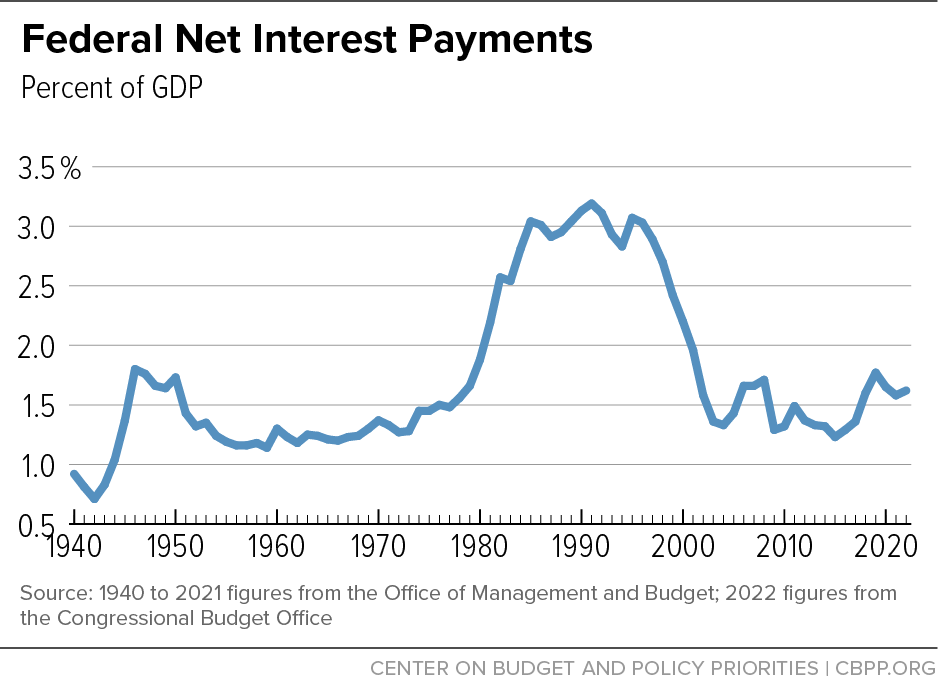
CBO estimates that in 2022 net interest payments will amount to $399 billion, or 7 percent of total federal expenditures and 1.6 percent of GDP. As Figure 2 shows, that ratio of interest costs to GDP is currently similar to that over most of the prior 70 years and only about half the level of interest costs from the mid-1980s to the mid-1990s, even though the debt ratio is currently well above its level during that decade. This phenomenon reflects the significance of interest rates, not just the level of debt, in determining the budgetary cost of debt.
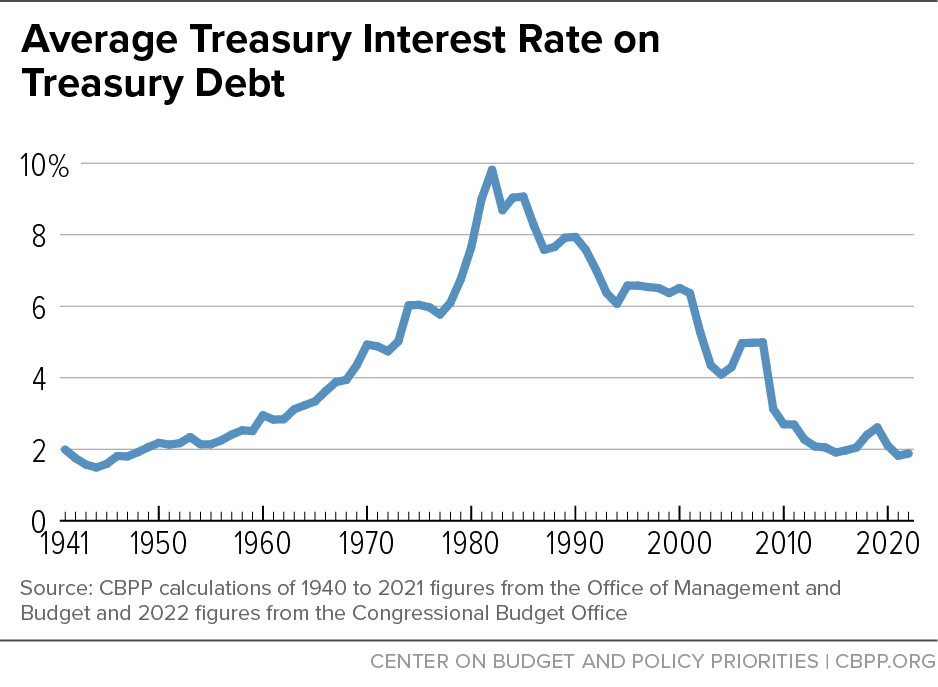
Figure 3 shows the average effective interest rate on outstanding debt over the same period. Effective interest rates on debt have ranged from a low of 1.5 percent in 1944 to a high of 9.8 percent in 1982. But Treasury interest rates are currently rising and CBO expects them to continue to do so, at the same time it projects debt to rise. This combination will raise the ratio of interest to GDP to 3.3 percent by 2032, according to CBO, slightly above the historically high levels of the 1980s to 1990s — with rising interest rates being the more important factor.
Debt Limit
Congress exercises its constitutional power over federal borrowing by permitting the Treasury to borrow as needed, but also by imposing a legal limit on the amount of money that the Treasury can borrow to finance its operations. The debt subject to that limit differs only slightly from the gross debt. Thus, it combines debt held by the public with the Treasury securities held by government trust and special funds, counting neither the financial assets (Treasury securities) held by trust funds nor other financial assets held by the government.
Once the debt limit is reached, the government must raise the debt limit, suspend the debt limit from taking effect, violate the debt limit, or default on its legal obligation to pay its bills. Congress has raised or suspended the debt limit more than 100 times since 1940. Between 2013 and 2021, the debt limit was temporarily suspended on seven occasions, but most recently it was raised (not suspended) to almost $31.4 trillion.
Raising or suspending the debt limit does not directly alter the amount of federal borrowing or spending going forward. Rather, it allows the government to pay for programs and services that Congress has already approved.
Nor is the need to raise or suspend the debt limit a reliable indicator of the soundness of budget policy. For example, Congress had to raise the debt limit more than 30 times between the end of World War II and the mid-1970s, even though the debt-to-GDP ratio fell very significantly over this period. Similarly, debt subject to the limit rose in the late 1990s — even though the budget was in surplus and the dollar levels of the debt held by the public was shrinking — because Social Security was also running large surpluses and lending them to the Treasury.
The Center on Budget and Policy Priorities is a nonprofit, nonpartisan research organization and policy institute that conducts research and analysis on a range of government policies and programs. It is supported primarily by foundation grants.


