CBO Data Show Tax Cuts Have Played Much Larger Role than Domestic Spending Increases in Fueling the Deficit
The new Congressional Budget Office budget projections released today show that the nation faces a fourth consecutive year of substantial budget deficits. Some seek to portray “runaway domestic spending” or growth in the costs of entitlement programs as the primary cause of the shift in recent years from sizeable surpluses to large deficits. Such a characterization is incorrect. In 2005, the cost of tax cuts enacted over the past four years will be over three times the cost of all domestic program increases enacted over this period.
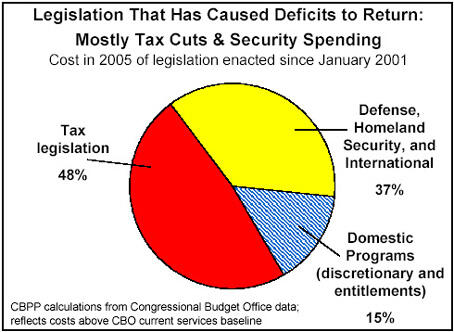
The new CBO data show that changes in law enacted since January 2001 increased the deficit by $539 billion in 2005. In the absence of such legislation, the nation would have a surplus this year. Tax cuts account for nearly half — 48 percent — of this $539 billion in increased costs. [1] Increases in program spending make up the other 52 percent and have been primarily concentrated in defense, homeland security, and international affairs.
The Administration has repeatedly defended its tax cuts as a needed stimulus during the recent economic downturn. But the downturn is behind us, and the cost of the tax cuts is scheduled to increase in the years ahead. Indeed, some of the tax cuts enacted in 2001 that benefit only high-income households have not even started to take effect yet. The repeal of the “personal exemption phase-out” for high-income taxpayers, as well as repeal of the limitation on itemized deductions for high-income taxpayers, do not start to phase in until 2006 and do not take full effect until 2010. Estate tax repeal also does not take effect until 2010.
A growing number of studies from highly respected institutions and economists have concluded that the negative effect on long-term growth of the increased deficits that the tax cuts are generating is likely to cancel out — and quite possibly to outweigh — any positive effects on long-term growth from reductions in marginal tax rates and other tax incentives in the 2001 and 2003 tax-cut packages. Stated simply, the tax cuts are more likely to reduce long-term growth than to increase it.[2]
Another way to evaluate the recent trends that have caused the shift from sizeable surpluses to large deficits is to look at how spending and revenues each have changed as a share of the economy over the 2000-2005 period. Such an analysis looks at all changes in revenues and spending, not just those that resulted from legislation. It shows that while there has been growth in spending as a share of the economy, the lion’s share of the swing from surpluses to deficits stems from a major drop in revenues.
In 2000, federal revenues equaled 20.9 percent of the Gross Domestic Product, the basic measure of the size of the economy. CBO projects that in 2005, revenues will amount to just 16.8 percent of GDP. This decline in revenues, equal to 4.0 percent of GDP, reflects the effects of the tax cuts, as well as an erosion in revenues caused by the bursting of the stock market bubble and a less robust economy overall. As Table 1 shows, the increase in program spending is less than two-thirds the decline in revenues.
| Table 1: | ||||
|
| As a Share of GDP | Share of Total Change | ||
| 2000 | 2005** | Change | ||
| Revenues | 20.86% | 16.82% | -4.04% | 71% |
| Programs | 16.13% | 18.62% | 2.49% | 44% |
| Interest* | 2.30% | 1.45% | -0.84% | -15% |
| Net Effect on the Deficit | 2.44% | -3.26% | -5.69% | 100% |
| * Interest payments declined as a share of GDP, despite the increase in deficits, because of the drop in interest rates. | ||||
Furthermore, under the new CBO projections, total federal spending will remain lower in 2005, as a share of the economy, than in any year from 1975-1996. As this indicates, federal spending is not at an unusually high level, even with the large increases in spending for Iraq and anti-terrorism efforts. The deficits that the nation now faces reflect not an unusually high level of spending, but rather an unusually low level of revenue. Indeed, CBO projects that federal revenues will be lower as a share of the economy in 2005 than in all years of the 1960s, the 1970s, the 1980s, and the 1990s.
End Notes
[1] Two percent of this cost relates to the extension of “temporary” provisions that are routinely extended, and thus should not be attributed to the Administration.
[2] See, for example, Mark M. Zandi, “Assessing President Bush’s Fiscal Policies,” Economy.com, July 2004; William Gale and Peter Orszag, “Bush Administration Tax Policy: Effects on Long-Term Growth,” Tax Notes, October 18, 2004; “Economic Effects of Making the 2001 and 2003 Tax Cuts Permanent,” Tax Policy Center Discussion Paper No. 17, October 2004; Isaac Shapiro and Joel Friedman, “Tax Returns: A Comprehensive Assessment of the Bush Administration’s Record on Cutting Taxes,” Center on Budget and Policy Priorities, April 2004; and Douglas W. Elmendorf and David L. Reifschneider, “Short-Run Effects of Fiscal Policy with Forward-Looking Financial Markets,” prepared for the National Tax Association’s 2002 Spring Symposium.
More from the Authors

