Income Inequality Hits Record Levels, New CBO Data Show:
Incomes Rose $180,000 for Top 1 Percent in 2005 but Just $400 for Middle-Income Households
Real after-tax incomes jumped by an average of nearly $180,000 for the top 1 percent of households in 2005, while rising just $400 for middle-income households and $200 for lower-income households, according to new data from the Congressional Budget Office (CBO).[1]
This starkly uneven growth brought income inequality to its highest level since at least 1979, when CBO began gathering these data. Taken together with prior research, the new data indicate that income is now more concentrated at the top than at any time since 1929. [2]
Other highlights of the CBO data show that as of 2005:
- The share of the nation’s total after-tax income going to the top 1 percent of households hit the highest level on record (with data back to 1979).
- The share of national after-tax income going to the middle fifth of households (the middle 20 percent) was the smallest on record.
- Similarly, the share of national after-income tax going to households in the bottom fifth was the smallest on record.
In addition, the share of national after-tax income going to the top 1 percent of households more than doubled between 1979 (when it stood at 7.5 percent) and 2005 (when it reached 15.6 percent). The $180,000 average income gain for these households in 2005 is more than three times the average middle-income household’s total income.
Income Growth in Recent Decades Occurring Mostly at the Top
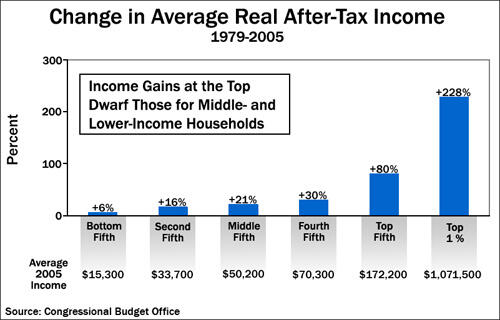
Over the 26-year period for which the new CBO data are available, income gains among high-income households have dwarfed those of middle- and low-income households. The CBO figures show:
- The average after-tax income of the top 1 percent of the population more than tripled, rising from $326,000 to over $1.07 million — for a total increase of $745,000, or 228 percent. (Figures throughout this paper were adjusted by CBO for inflation and are presented in 2005 dollars.)
- By contrast, the average after-tax income of the middle fifth of the population rose a relatively modest 21 percent, or $8,700, reaching $50,200 in 2005.
- The average after-tax income of the poorest fifth of the population rose just 6 percent, or $900, over the past 26 years, reaching $15,300 in 2005.[3]
As a result, the CBO figures show, the gap between the wealthiest Americans and everybody else grew to its widest point since at least 1979.
- The top 1 percent of households received 70 times as much in average after-tax income as the bottom one-fifth of households in 2005 — the widest such income gap on record, with data available back to 1979. The previous record was 63 times as much, set in 2000. In 1979, by comparison, the richest households made 23 times as much as the poorest households.
- The average income of the top 1 percent of households was more than 21 times that of the middle one-fifth of households. This, too, was the widest such ratio on record.
Income Gaps Widened in 2005
The CBO data show that gaps in income inequality widened significantly between 2004 and 2005. The share of total after-tax income going to the top 1 percent rose from 14.0 percent in 2004 to 15.6 percent in 2005, an increase of 1.6 percentage points. This amounts to nearly $180,000 per household in the top 1 percent, which is equivalent to approximately $123 billion in additional income for the top 1 percent as a whole.
The top 1 percent saw its total income rise by $180,000 in 2005 — more than the average middle-income household makes in three years.
In contrast, income gains between 2004 and 2005 were quite modest for middle- and lower-income households. Average income rose 0.8 percent (or $400) for middle-income households and 1.3 percent (or $200) for the poorest fifth of households. This compares to a stunning 20.2 percent increase in income ($180,000 per household) for the top 1 percent. In percentage terms, this was the largest one-year income gain for the top 1 percent in 17 years.[4] In dollar terms, it was the largest one-year gain since 1979, the first year for which the CBO data are available.
The growing concentration of income at the top of the income scale continues a long-term trend. Income concentration grew steadily during the latter half of the 1990s, rising through 2000, a year that the stock market hit a record high. From 2000 to 2002, income became less concentrated at the very top, partially due to the drop in the stock market; after-tax incomes fell from 2000 to 2002 for most income groups, but declined the most for the top 1 percent. From 2003 through 2005, however, the long-term trend toward growing income inequality returned. The CBO figures show that in 2005, the share of income going to the top 1 percent reached 15.6 percent, compared with the previous high of 15.5 percent in 2000.[5]
| Change in Real Average After-Tax Income, 2004 to 2005 (in 2005 dollars) | ||
| Income Category | Dollar Change | Percent Change |
|---|---|---|
| Lowest fifth | $200 | +1.3% |
| Second fifth | 200 | +0.6% |
| Middle fifth | 400 | +0.8% |
| Fourth fifth | 400 | +0.6% |
| Top fifth | 11,800 | +7.4% |
| Top1 Percent | 179,900 | +20.2% |
| Source: Congressional Budget Office, Effective Federal Tax Rates: 1979-2005, December 2007. | ||
Recent Federal Tax Policies Are Exacerbating Income Gaps
Legislation enacted since 2001 has provided taxpayers with about $1 trillion in tax cuts over the past six years. These large tax reductions have made the distribution of after-tax income more unequal. Because high-income households received by far the largest tax cuts, the tax cuts have increased the concentration of after-tax income at the top of the spectrum.
The CBO data do not provide a direct measure of the impact of these tax policy changes because they reflect the impact not only of legislative changes but also of changes in household incomes and other factors that influence tax payments. Direct estimates by the Urban Institute-Brookings Institution Tax Policy Center that consider only the impact of the recent tax policy changes provide definitive evidence that the recent tax cuts have widened income inequality. The Tax Policy Center has found that as a result of the tax cuts enacted since 2001:[6]
- Households in the bottom fifth of the income spectrum received tax cuts in 2006 that averaged $20 and raised their after-tax incomes by an average of 0.3 percent.
- Households in the middle fifth of the income spectrum received tax cuts averaging $740 that raised their after-tax incomes an average of 2.5 percent.
- But the top 1 percent of households received tax cuts averaging $44,200 in 2006, which increased their after-tax income an average of 5.4 percent.
- And households with incomes exceeding $1 million received an average tax cut of $118,000 in 2006, which represented an increase of 6.0 percent in their after-tax income. That is more than double the percentage increase received by the middle fifth of households. [7]
Furthermore, some of the tax cuts enacted in 2001 are still being phased in, and the tax cuts still phasing in are heavily tilted to people at the top of the income scale. These include the elimination of the tax on the nation’s largest estates and two income-tax cuts that started to take effect on January 1, 2006 and go almost exclusively to high-income households.[8] As a result, the tax cuts will ultimately be even more skewed toward high-income households, and will increase income inequality to a still larger degree, than was the case in 2006.
| Average After-Tax Income by Income Group, 1979-2005 (in 2005 dollars) | ||||
| Income Category | 1979 | 2005 | Percent Change 1979-2005 | Dollar Change 1979-2005 |
|---|---|---|---|---|
| Lowest fifth | $14,400 | $15,300 | 6% | $900 |
| Second fifth | 29,100 | 33,700 | 16% | 4,600 |
| Middle fifth | 41,500 | 50,200 | 21% | 8,700 |
| Fourth fifth | 54,300 | 70,300 | 29% | 16,000 |
| Top fifth | 95,700 | 172,200 | 80% | 76,500 |
| Top1 Percent | 326,400 | 1,071,500 | 228% | 745,100 |
| Source: Congressional Budget Office, Effective Federal Tax Rates: 1979-2005, December 2007. | ||||
End Notes
[1] Congressional Budget Office, Historical Effective Federal Tax Rates: 1979 to 2005, December 2007.
[2] Thomas Piketty and Emmanuel Saez, “Income Inequality in the United States, 1913-1998,” Quarterly Journal of Economics, 118, 2003. Piketty and Saez’ tables have been updated through 2005 at http://emlab.berkeley.edu/users/saez/ The Piketty and Saez data are discussed further in Aviva Aron-Dine, “New Data Show Income Concentration Jumped Again in 2005,” Center on Budget and Policy Priorities, revised October 24, 2007. https://www.cbpp.org/3-29-07inc.htm
[3] In the CBO data, the income categories do not represent a fixed group of people from year to year but rather represent the people who fall into the various income categories in the year in question. As a result, the people in a given income category shift somewhat over time. This does not alter the conclusions of this paper but means that the trends shown in the data do not necessarily match the income trajectories of individual households.
[4] Since 1979 (the first year for which CBO data are available), the after-tax income for the top 1 percent has increased by more than 20 percent only in 1986 and 1988. Analysts generally consider income data for the 1986-1988 period anomalous because a substantial amount of income "shifting" occurred during those years in response to enactment of the 1986 Tax Reform Act. Many high-income individuals chose to realize capital gains in 1986 in order to avoid paying the higher capital gains tax rates that took effect in 1987; this artificially increased the incomes of high-income households in 1986 and artificially reduced those incomes in 1987. For further discussion, see Joel Slemrod, "Income Creation or Income Shifting? Behavioral Responses to the Tax Reform Act of 1986," The American Economic Review, May 1995, pp. 175-180.
[5] As the Economic Policy Institute has noted, the two-year increase in the share of income (both pre- and post-tax) going to the wealthiest Americans was greater from 2003 to 2005 than in any other two-year period covered by the CBO data. See Jared Bernstein, "Updated CBO Data Reveal Unprecedented Increase in Inequality," Economic Policy Institute, December 13, 2007, http://www.epi.org.
[6] See Tax Policy Center tables T06-0273 and T06-0279 at http://www.taxpolicycenter.org.
[7] CBO’s data show that the share of total federal taxes paid by the top 1 percent of households rose from 25.4 percent in 2004 to 27.6 percent in 2005, the highest share on record in the CBO data. The rising share of taxes paid by the wealthy is often cited erroneously as evidence that the tax burden on the highest-income households is rising. In fact, as CBO Director Peter Orszag has pointed out in his Director’s Blog, the increase in the share of taxes paid by the top 1 percent of households from 2004 to 2005 “occurred despite a slight decline in the effective tax rate applied to income among the top 1 percent (from 31.4 percent to 31.2 percent) because the share of pretax income accruing to that part of the income distribution rose from 16.3 percent in 2004 to 18.1 percent in 2005.” Indeed, the effective tax rate of the top 1 percent of households was lower in 2005 than in any year since 1992.
[8] See Aviva Aron-Dine and Robert Greenstein, “Two High Income Tax Cuts Not Yet Fully in Effect Will Cost Billions Over the Next Five Years,” Center on Budget and Policy Priorities, Feb. 1, 2007, https://www.cbpp.org/2-1-07tax.htm.
More from the Authors
