Capital Gains Tax Cuts Slashed Taxes of Top 400, While Their Incomes SoaredCapital Gains Tax Cuts Slashed Taxes of Top 400, While Their Incomes Soared
New Internal Revenue Service (IRS) data show that the 400 U.S. taxpayers with the very highest incomes pay only 18 percent of their income, on average, in federal individual income taxes. The data, published by the Wall Street Journal and the Urban-Brookings Tax Policy Center, provide detailed income and tax information for the 400 tax filers with the highest adjusted gross incomes (AGI) in each year from 1992 to 2005.[1] They show that while the incomes of those at the top have skyrocketed, their tax rates have fallen significantly, with the largest reductions occurring after the capital gains tax cuts of 1997 and 2003.
Rapid Income Gains in Late 1990s and Last Few Years
Other IRS data show that high-income groups have fared extremely well over the past decade and a half; for example, the average income of the top 1 percent of filers rose by 89 percent between 1992 and 2005, after adjusting for inflation. The new data show that, among the top 400 taxpayers — 3 out of every 1 million filers — pre-tax income gains were even larger.
Between 1992 and 2005, the average AGI of the top 400 tax filers increased by 235 percent, after adjusting for inflation: from $64 million to $214 million in 2005 dollars. (To make it into the top 400, a filer needed AGI of $33 million in 1992 and $100 million in 2005.) The incomes of this group grew rapidly between 1995 and 2000, dropped during the 2001 recession, but then rose rapidly again from 2002 to 2005.
Tax Rates Fell, So After-Tax Incomes Rose By An Even Larger Percentage
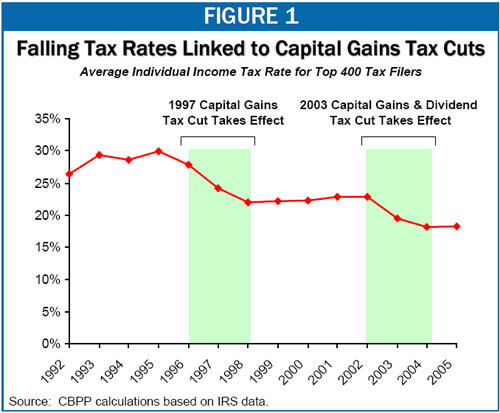
Even as pre-tax incomes shot up for the very highest-income filers, their effective individual income tax rate — the share of their pre-tax income paid in federal personal income taxes — fell sharply. In 1995, the top 400 filers paid an average of 30 percent of their income in personal income taxes. By 2005, the average had fallen to 18 percent. (See Figure 1.) Moreover, in 1995, almost no one in the top 400 paid less than 15 percent of his or her income in federal income tax; by 2005, more than a third did. The drop in effective tax rates for the top 400 filers between 1995 and 2005 worked out to a tax reduction of $25 million per filer in 2005, or to a total of $10 billion in tax reductions for these 400 households.
Because of this steep reduction in effective tax rates, the after-tax incomes of the top 400 grew even faster than their pre-tax incomes. Over the 1992 to 2005 period, when the average pre-tax income of these filers rose by 235 percent, their average income after federal income taxes increased by 272 percent.[2]
Capital Gains Tax Cuts Played Large Role in Reducing the Tax Rates of the Most Well-Off
Two of the largest reductions in tax rates for the top 400 filers occurred in two two-year periods: 1996-1998 and 2002-2004. In 1996, these filers paid 28 percent of their income in income taxes, on average; by 1998, that had fallen to 22 percent. In 2002, these filers paid 23 percent of their income in income taxes, on average; by 2004, that had fallen to 18 percent.
The primary explanation for these large declines appears to be the capital gains tax cuts enacted in 1997 and 2003 (and, to a lesser extent, the dividend tax cut enacted in 2003).[3] In 2005, the top 1 percent of filers derived 54 percent of their income from capital gains, and an additional 6 percent from dividends.[4] The 1997 tax cut reduced the top tax rate on long-term capital gains from 28 percent to 20 percent, and the 2003 tax cut lowered that rate further to 15 percent, while also setting the tax rate for dividends equal to the tax rate for capital gains.
The top marginal tax rate on capital gains and dividend income thus stands at 15 percent, less than half the top tax rate on wages and salaries. An inevitable consequence of this is that the very highest-income filers — who derive a large fraction of their income from investments rather than wages and salaries — now pay tax at very low effective rates.
End Notes
[1] The data are discussed in Tom Herman, “There’s Rich and There’s the Fortunate 400,” Wall Street Journal, March 5, 2008, and Len Burman, “The Rich Are Different,” http://taxvox.taxpolicycenter.org/ and can be found on the Tax Policy Center website at http://www.taxpolicycenter.org/taxfacts/displayafact.cfm?Docid=260&Topic2id=48.
[2] Other evidence suggests that overall federal tax rates for those at the very top also fell during this period. In an important recent study, economists Thomas Piketty and Emmanuel Saez examined trends in effective individual income, corporate income, payroll, and estate taxes on high-income households, looking at groups up to the top one-hundredth of 1 percent of the population. Their research shows that over the period covered by the new IRS data (1992-2005), payroll tax rates on very high-income households increased, but effective corporate and estate tax burdens fell by more than enough to compensate. See Thomas Piketty and Emmanuel Saez, “How Progressive Is the U.S. Federal Tax System? A Historical and International Perspective,” Journal of Economic Perspectives, Winter 2007.
[3] Both the capital gains tax cuts took effect mid-year. As a result, they had some effect on effective tax rates in the year of enactment, but their full effects were not felt until the following year; hence, the effects of these tax cuts are reflected in the data over the 1996-1998 and 2002-2004 periods. Reductions in marginal income tax rates enacted in 2001 and accelerated in 2003 undoubtedly also had a significant impact on tax rates for this group.
[4] These figures include only capital gains and dividends that qualify for the preferential capital gains and dividend tax rates.
More from the Authors