Public Benefits: Easing Poverty and Ensuring Medical Coverage
When individuals and families experience crises such as job loss, illness, disability, or divorce, they may face the prospect of falling into poverty (or becoming poorer) and losing health insurance coverage. Various government assistance programs are designed to lessen these hardships. These programs also provide support when families work but have low earnings and when people reach retirement age.
An examination of Census data shows that as a whole, the U.S. public benefits system, sometimes referred to as the “safety net,” has the following effects on poverty and health insurance status.
- It cuts the number of Americans living in poverty almost in half. (As discussed later, the Census data used here understate the degree to which public benefits ease poverty.)
- It reduces the severity of poverty for those who remain poor. Without these programs, these families would have average disposable income equal to 29 percent of the poverty line. With the programs, their average income rises to 57 percent of the poverty line.
- It provides health care coverage to tens of millions of individuals who otherwise would be uninsured.
There are two principal categories of public benefit programs — those that provide benefits regardless of income and those that limit assistance to people with low or modest incomes. The first category of programs includes the major social insurance programs such as Social Security, unemployment insurance, and Medicare. Programs in the second category are often referred to as “means-tested” programs.
Means-tested programs play a large role in reducing the extent and severity of poverty and providing health care to low-income Americans. Some 11 million low-income Americans are lifted above the poverty line by means-tested benefits, and more than 55 million receive health insurance from the means-tested medical programs, Medicaid and SCHIP. Most of these people would otherwise be uninsured.
This analysis provides an overview of the role of income support programs in reducing poverty and the role of health insurance programs in providing access to needed health care. It also examines the effects of these programs on different demographic groups and how the effects of these programs compare with the effects of comparable programs in other countries. The programs examined here could be strengthened, as is indicated by the continuing existence of significant poverty in the United States and the large number of individuals who lack health insurance as well as by the fact that other wealthy industrialized nations provide stronger assistance (particularly for low-income families with children) and generally have lower poverty rates. Nevertheless, the strengths of the public benefits programs in the United States are impressive.
Public Income Support Cuts Poverty Nearly in Half
Public income support in the United States comes from programs that are not limited to people with low incomes, such as Social Security and unemployment insurance, and from means-tested programs, which are targeted by income. (See Table 1.) The means-tested programs include traditional income assistance, such as that provided by the Temporary Assistance for Needy Families (TANF) and Supplemental Security Income (SSI) programs, and “near-cash” benefits, such as food assistance[i] and housing subsidies, which are not provided in cash but are used to pay regular monthly bills. Certain tax credits, such as the Earned Income Tax Credit (EITC), are also means-tested.
| TABLE 1: |
| Income Supports Social Insurance
Means-Tested Benefits
Refundable Tax Credits (see endnote 2)
Veterans’ Payments |
| Health Insurance
|
To examine the combined effect of these programs, we analyzed Census Bureau data on families’ disposable income – that is, their incomes after subtracting income and payroll taxes and adding all cash income assistance, food assistance, housing subsidies, and energy assistance benefits. This analysis accounts for all of the public benefits listed in Table 1, including cash payments, tax credits, and near-cash assistance.[ii] An analysis of Census data for 2003 (the latest year for which these data are available) shows that:
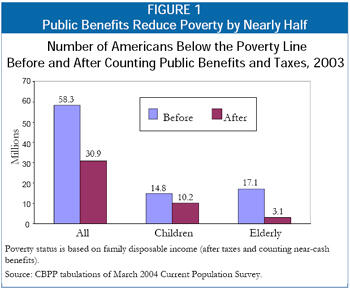
- Public income-support programs lifted 27 million Americans above the poverty line. That is, the programs reduced the number of Americans with disposable income below the poverty line from 58 million people when income from the programs is not considered to slightly less than 31 million when it is counted. This constitutes a reduction of 47 percent in the number of people who lived in poverty.
- Among those who remained in poverty, these programs eased the severity of poverty by lifting the average poor person from 29 percent of the poverty line when this assistance is not considered to 57 percent of the poverty line with this assistance.
- Means-tested benefits and tax credits alone lifted nearly 11 million Americans above the poverty line. Stated differently, in the absence of the income that these means-tested policies provide, more than 41 million Americans would have had income below the poverty line in 2003. Counting the means-tested benefits and tax credits, the number in poverty was reduced to just under 31 million.
- Means-tested policies play a particularly important role in reducing the severity of poverty among those whose incomes remain below the poverty line. On average, poor people have family income that equals just 39 percent of the poverty line when all income is counted except income from means-tested benefits and refundable tax credits. When means-tested benefits and tax credits are counted, the average disposable income of poor individuals rises to 57 percent of the poverty line.
When Public Health Insurance Is the Only Health Insurance
U.S. programs and policies provide health insurance coverage for eligible elderly people, low-income families with children, and individuals with severe disabilities. The two principal public health insurance programs are Medicare, for seniors and many non-elderly individuals with disabilities, and Medicaid, for low-income children, families, the elderly, and individuals with disabilities. Closely related to Medicaid is the State Children’s Health Insurance Program (SCHIP), which provides health insurance to children whose families earn too much to qualify for traditional Medicaid but nevertheless have low incomes. All together, the programs provide health insurance for over 80 million Americans each month, administrative records show. The means-tested medical programs, Medicaid and SCHIP, provide coverage for more than 55 million low-income people over the course of a year, including some low-income individuals for whom Medicaid pays their Medicare premiums and deductibles.
The majority of Medicaid enrollees lack any other health insurance during the year. Census data for 2003 show that:
- Four of five people enrolled in Medicaid or SCHIP had no private insurance during the year and relied exclusively on public health coverage.[iii]
- Two of five Medicare enrollees had no private insurance during the year and relied exclusively on public health care coverage.
- More than 40 million Americans received their only health insurance during the year from government programs. [iv]
- Another 45 million Americans had no health insurance at all.
It is worth noting that federal policies affect the health insurance status of more Americans than those covered by Medicare, Medicaid, and SCHIP. Many Americans are affected by federal tax exclusions and deductions for health insurance, and the federal government directly insures millions of federal employees, military personnel, and their dependents, and provides health care to veterans. This analysis focuses on the main public health insurance programs — Medicare, Medicaid, and SCHIP.
Approach to Measuring Poverty
The source of data that we use, the March Current Population Survey, is the same source used in official Census Bureau poverty reports. Poverty, as defined here, means having annual disposable income below the federal poverty line, which was $14,680 for a three-person family in 2003, and $18,810 for a family of four.
Disposable income means family income after taxes and includes all cash income plus food stamps, school lunch, housing assistance, and energy assistance. The taxes reflected here are federal payroll taxes and federal and state income taxes, including tax credits. This definition of income is broader than the cash-only definition used in official poverty statistics. It is similar to alternative income definitions used in a variety of government poverty reports and studies by other researchers. A broad definition of income is necessary to capture the impact of non-cash benefits and tax policy on poverty.
This approach to measuring poverty, while more complete than the official measure, is limited by available data. For example, we do not subtract families' expenditures on items such as medical or work expenses. Many poverty experts believe that a revised poverty measure should reflect recent increases in such out-of-pocket expenses, although currently there is little agreement on how that should be done. Questions have also been raised about the approach used by the Census Bureau to estimate the value of particular benefits, as well as about whether the poverty line itself is out of date and needs to be increased. Any attempt to redefine the official poverty measure should address these issues.
We do not count the value of medical benefits when determining income or poverty status. We consider the impact of those benefits on health insurance status.
Lifted out of poverty by a particular benefit means that a family’s disposable income would be below the poverty line if income from that benefit were not counted but is above the poverty line when the benefit is counted. (Note: An individual thus may be counted as being lifted out of poverty by more than one program.)
Approach Understates Effects of Aid
The estimates of people lifted out of poverty in this analysis — and estimates of the reductions in poverty’s severity — are likely to be understated because of limitations of the Census data. Census surveys miss a substantial fraction of the participants in public programs such as SSI, TANF, and food stamps. Moreover, those who report receiving some income support from a public program may not remember or report the full amount received. The result is a significant undercount of program participants and how much support they receive.
Behavioral Effects
This analysis does not address how people might respond to changes in policy. For example, if all health programs were eliminated, some people who lack private health coverage might purchase private insurance; many others likely would become uninsured. Similarly, if a number of public income supports were eliminated, some people might work more; many others likely would become poor or more deeply poor. (On the other hand, some income supports such as the EITC have been found to increase employment by rewarding work; if these work supports were eliminated, employment might decline.) This analysis does not attempt to predict such changes in behavior.
Anti-Poverty Efforts Help Some Groups More Than Others
The effectiveness of U.S. anti-poverty policies varies by age and other factors. Public benefit programs are most effective at reducing poverty among the elderly. Although these programs are considerably less effective at reducing poverty among families with children, they still lift 4.6 million otherwise-poor children above the poverty line.
The U.S. system of public benefits is weakest for poor adults who are not elderly or disabled and not raising minor children. These individuals seldom are eligible for either income assistance or health care coverage. The safety net also is much weaker for legal immigrants, many of whom now are barred because of their immigrant status from programs for which they otherwise would qualify.
Effectiveness for the Elderly
The nation’s most potent income-security policies are for the elderly. The combination of Social Security, SSI, food stamps, and other programs reduced the overall number of seniors living in poverty in 2003 by 14 million (more than 80 percent), and lifted the disposable income of those remaining in poverty from an average of just 8 percent of the poverty line to 62 percent of the poverty line. In addition, Medicare and Medicaid combine to provide health insurance for virtually all of the 35 million Americans age 65 and older.
Even for seniors, gaps in the safety net remain. In many cases, Social Security payments are not large enough to lift recipients out of poverty, and some retirees (such as domestic or seasonal workers whose past employers failed to pay the required Social Security payroll taxes) may receive little or no Social Security benefit. Seniors who qualify for small or no Social Security benefits are supposed to be covered by the Supplemental Security Income program, but SSI pays a maximum federal benefit that is 27 percent below the poverty line for an individual living alone. Partly as a result, 3.1 million seniors had disposable family incomes below the poverty line in 2003, even after all benefits are counted.
Another 13.7 million seniors remained barely above this income range, with disposable incomes between one and two times the poverty line (between $8,825 and $17,650 a year in 2003 for a senior living alone). While seniors are the least likely age group to live below the poverty line, they are the most likely age group to be just above the poverty line. (It should be noted that many near-poor seniors are not counted as poor because of a quirk in the poverty line itself. The federal poverty line is set 8 to 10 percent lower for elderly single individuals and couples than for similar non-elderly individuals and couples. Most of the elderly live alone or with a spouse. If the poverty definition were adjusted to use the same poverty line for the elderly as for the non-elderly, the poverty rate for seniors would be slightly higher, rather than lower, than the poverty rate for younger adults. )
Effectiveness for Families with Children
Public benefits also substantially reduce the amount and severity of poverty for families with children, although not nearly to the same degree as they do for seniors. Government benefits lifted nearly one of every three otherwise-poor children above the poverty line in 2003. For millions of other poor children, poverty was made less severe than it otherwise would have been.
Over the past two decades, the nature of the safety net has changed markedly for families with children. Assistance has expanded for low-income working families with children; low-income working families can now receive a stronger federal earned income tax credit (EITC), greater federal and state child care assistance, and greater health insurance coverage, among other supports. Most families with children that are lifted above the poverty line by public benefits are working families.
At the same time, protections have weakened for the poorest families (those with very low or no earnings) due to restrictions in TANF income assistance. To be eligible for income assistance through TANF, families typically must have incomes far below the poverty line. Despite this, the federal government estimates that only about half of families with children that are poor enough to qualify for TANF income assistance now receive it. In the mid-1990s, about 80 percent of families who qualified for the predecessor AFDC program received income assistance.
Many poor families also are being left deeper in poverty due in part to the overall reduction in the amount of income assistance provided through the TANF program. A poor child now is more likely to experience deep poverty than was the case a decade ago. Nearly one in three poor children (31 percent) had disposable income below half of the poverty line in 2003, compared with fewer than one in four (23 percent) in 1995.
Immigrants and Non-Elderly Childless Individuals
The U.S. safety net is weakest for two other groups — immigrants and non-elderly individuals without children. For immigrant families, eligibility for safety-net programs ranging from food stamps to medical assistance was sharply restricted in the mid-1990s. These cuts have been restored only partially in the years since then. In 2002, low-income people in families headed by an immigrant were only half as likely as Americans overall to have their family income lifted above the poverty line by public benefits.
For individuals who are not raising minor children (and are not elderly or disabled), cash income support and publicly-funded health insurance are not widely available, and housing programs give low priority to serving such people. Even the food stamp program, which has relatively few limitations on eligibility for those who meet its financial requirements, imposes much more severe restrictions on these individuals. Most individuals between the ages of 18 and 50 who do not have disabilities and are not raising minor children are eligible for food stamps for only three months while out of work in any 36-month period. The safety net largely bypasses these individuals, doing little to lessen the severity of their poverty. In addition, federal and state tax policies actually tax this group somewhat deeper into poverty.
Public Benefits Are Stronger, More Effective in Other Countries
Public benefit programs in the United States could be stronger. This can be seen by a comparison with other nations. Most other Western industrialized nations have more effective anti-poverty policies — and lower poverty rates — than does the United States, especially for children.
Research by economist Timothy M. Smeeding, one of the foremost experts on public benefit programs in developed nations, has shown that government cash and non-cash benefits and tax credits in the United State lift only 1 in 9 otherwise-low-income children to half of the national median income. The equivalent programs in Canada lift 1 in 3 such children to half of that country’s median income. In Britain, Germany, the Netherlands, Belgium, and other countries, the figure is more than 1 in 2.[v]
Smeeding also found that children at the bottom of the economic ladder in the United States tend to have lower real incomes, with less buying power, than their counterparts in these other nations. Thus, the poorest 25 percent of American children have lower family incomes than do the poorest 25 percent of Canadian children. And the poorest 22 percent of American children have lower income than the poorest 22 percent of German children. This is the case even though the United States is a wealthier nation overall, with a higher per-capita gross domestic product.[vi]
The United Kingdom provides an example of how a nation can make significant strides against poverty. The British government stepped up its anti-poverty efforts markedly after Prime Minister Tony Blair pledged in 1999 to end child poverty within 20 years and cut it in half in ten years. To achieve this ambitious poverty reduction goal, the United Kingdom has strengthened public benefits and provided new work supports such as child care and a U.S.-style EITC to families. Smeeding calculates that the proportion of British children who would be considered below the poverty line by U.S. standards has dropped since 1999 by more than one-third. [vii]
Conclusion
The U.S. system of public benefits achieves important objectives. It reduces both the extent and depth of poverty while ensuring that millions of Americans have access to medical care. This system lifts 27 million people out of poverty and provides health insurance to tens of millions of people who otherwise would be uninsured.
Both social insurance programs and programs targeted on low-income Americans play an important role. Social Security lifts millions of seniors and families in which a breadwinner has become disabled or has died out of poverty. Programs such as the EITC, SSI, and food stamps help those who receive little or no help from the social insurance programs to meet basic needs. The means-tested assistance programs lift 11 million Americans out of poverty.
In addition, public health insurance programs — Medicare, Medicaid, and SCHIP — provide access to medical care to more than one in four Americans, including nearly all of the nation’s elderly. Without these programs, the ranks of the uninsured — already 45 million strong — would be far more numerous.
| TABLE 2: | |||||||
| Total Persons | Poor Before Counting Benefits and Taxes | Poor After Counting Benefits and Taxes | Number Lifted Above the Poverty Line | 90% Margin of Error | Percent Reduction in Number Poor | 90% Margin of Error | |
| US Total | 284,830,000 | 56,157,000 | 29,501,000 | 26,656,000 | ±429,000 | 47 | ±0.6 |
| Alabama | 4,409,000 | 1,095,000 | 559,000 | 536,000 | ±57,000 | 49 | ±4.0 |
| Alaska | 636,000 | 88,000 | 48,000 | 40,000 | ±6,000 | 46 | ±5.3 |
| Arizona | 5,432,000 | 1,153,000 | 658,000 | 495,000 | ±63,000 | 43 | ±4.3 |
| Arkansas | 2,670,000 | 764,000 | 414,000 | 350,000 | ±37,000 | 46 | ±3.9 |
| California | 34,924,000 | 6,887,000 | 3,932,000 | 2,955,000 | ±176,000 | 43 | ±2.0 |
| Colorado | 4,450,000 | 646,000 | 380,000 | 267,000 | ±38,000 | 41 | ±4.7 |
| Connecticut | 3,393,000 | 506,000 | 213,000 | 294,000 | ±36,000 | 58 | ±5.0 |
| Delaware | 801,000 | 115,000 | 52,000 | 62,000 | ±9,000 | 55 | ±5.5 |
| District of Columbia | 558,000 | 127,000 | 86,000 | 41,000 | ±6,000 | 32 | ±4.4 |
| Florida | 16,530,000 | 3,705,000 | 1,845,000 | 1,859,000 | ±116,000 | 50 | ±2.4 |
| Georgia | 8,411,000 | 1,549,000 | 874,000 | 675,000 | ±86,000 | 44 | ±4.4 |
| Hawaii | 1,224,000 | 199,000 | 104,000 | 95,000 | ±13,000 | 48 | ±5.1 |
| Idaho | 1,322,000 | 240,000 | 123,000 | 118,000 | ±15,000 | 49 | ±4.8 |
| Illinois | 12,475,000 | 2,389,000 | 1,268,000 | 1,122,000 | ±90,000 | 47 | ±2.9 |
| Indiana | 6,082,000 | 1,094,000 | 509,000 | 585,000 | ±64,000 | 54 | ±4.2 |
| Iowa | 2,891,000 | 487,000 | 212,000 | 276,000 | ±32,000 | 57 | ±4.7 |
| Kansas | 2,664,000 | 466,000 | 235,000 | 231,000 | ±29,000 | 50 | ±4.7 |
| Kentucky | 4,041,000 | 975,000 | 475,000 | 501,000 | ±52,000 | 51 | ±4.0 |
| Louisiana | 4,413,000 | 1,119,000 | 662,000 | 457,000 | ±55,000 | 41 | ±4.0 |
| Maine | 1,274,000 | 295,000 | 123,000 | 173,000 | ±17,000 | 59 | ±4.0 |
| Maryland | 5,408,000 | 691,000 | 387,000 | 305,000 | ±47,000 | 44 | ±5.4 |
| Massachusetts | 6,376,000 | 1,089,000 | 501,000 | 588,000 | ±60,000 | 54 | ±3.9 |
| Michigan | 9,890,000 | 1,875,000 | 936,000 | 939,000 | ±79,000 | 50 | ±3.1 |
| Minnesota | 5,010,000 | 645,000 | 300,000 | 345,000 | ±46,000 | 53 | ±5.2 |
| Mississippi | 2,810,000 | 773,000 | 439,000 | 334,000 | ±39,000 | 43 | ±4.0 |
| Missouri | 5,567,000 | 1,009,000 | 492,000 | 517,000 | ±61,000 | 51 | ±4.5 |
| Montana | 903,000 | 218,000 | 105,000 | 112,000 | ±13,000 | 52 | ±4.4 |
| Nebraska | 1,701,000 | 283,000 | 151,000 | 132,000 | ±18,000 | 47 | ±4.9 |
| Nevada | 2,162,000 | 334,000 | 165,000 | 169,000 | ±21,000 | 51 | ±4.8 |
| New Hampshire | 1,261,000 | 164,000 | 64,000 | 100,000 | ±13,000 | 61 | ±5.3 |
| New Jersey | 8,538,000 | 1,327,000 | 595,000 | 732,000 | ±67,000 | 55 | ±3.5 |
| New Mexico | 1,833,000 | 485,000 | 285,000 | 200,000 | ±25,000 | 41 | ±4.3 |
| New York | 18,976,000 | 4,057,000 | 2,145,000 | 1,912,000 | ±112,000 | 47 | ±2.1 |
| North Carolina | 8,151,000 | 1,858,000 | 996,000 | 863,000 | ±77,000 | 47 | ±3.3 |
| North Dakota | 627,000 | 123,000 | 64,000 | 59,000 | ±7,000 | 48 | ±4.5 |
| Ohio | 11,219,000 | 2,074,000 | 1,009,000 | 1,064,000 | ±87,000 | 51 | ±3.1 |
| Oklahoma | 3,425,000 | 752,000 | 422,000 | 331,000 | ±40,000 | 44 | ±4.2 |
| Oregon | 3,503,000 | 682,000 | 343,000 | 339,000 | ±41,000 | 50 | ±4.5 |
| Pennsylvania | 12,130,000 | 2,404,000 | 1,024,000 | 1,381,000 | ±95,000 | 57 | ±2.8 |
| Rhode Island | 1,050,000 | 202,000 | 83,000 | 119,000 | ±12,000 | 59 | ±4.3 |
| South Carolina | 4,015,000 | 920,000 | 475,000 | 445,000 | ±50,000 | 48 | ±4.2 |
| South Dakota | 743,000 | 140,000 | 69,000 | 71,000 | ±8,000 | 51 | ±4.4 |
| Tennessee | 5,742,000 | 1,343,000 | 698,000 | 645,000 | ±74,000 | 48 | ±4.3 |
| Texas | 21,446,000 | 4,678,000 | 2,908,000 | 1,770,000 | ±131,000 | 38 | ±2.3 |
| Utah | 2,304,000 | 317,000 | 195,000 | 122,000 | ±20,000 | 38 | ±5.1 |
| Vermont | 610,000 | 109,000 | 46,000 | 63,000 | ±7,000 | 58 | ±4.7 |
| Virginia | 7,185,000 | 1,061,000 | 574,000 | 487,000 | ±68,000 | 46 | ±4.9 |
| Washington | 5,995,000 | 1,120,000 | 568,000 | 551,000 | ±68,000 | 49 | ±4.6 |
| West Virginia | 1,767,000 | 557,000 | 260,000 | 297,000 | ±25,000 | 53 | ±3.4 |
| Wisconsin | 5,399,000 | 882,000 | 392,000 | 489,000 | ±56,000 | 55 | ±4.6 |
| Wyoming | 487,000 | 83,000 | 38,000 | 46,000 | ±6,000 | 55 | ±4.9 |
| Poor refers to persons in families with disposable income below the poverty line. Disposable income includes cash income, food assistance, housing subsidies, energy assistance, payroll tax, and the effect of federal and state income taxes including tax credits. Source: CBPP tabulations of March 2002-2004 Current Population Surveys. | |||||||
End Notes
[i] Food assistance in this report includes the food stamps and school lunch programs. When estimating the effect of public income supports as a whole, we include the value of all school lunch subsidies, including subsidies for regular-priced school lunches, as well as for free and reduced-price lunches. Estimates of means-tested benefits include only the value of free and reduced-price lunches.
[ii] When estimating the effects of public income supports as a whole, we also consider reductions in families’ disposable income due to the tax system, including payroll taxes and federal and state income taxes, in order to provide a more complete picture of the role of government policies. Thus, we calculate that public benefits by themselves would reduce the number of Americans in poverty by 28 million, but after taking into account what low-income families must pay in taxes, public benefits — in conjunction with income and payroll taxes — reduce the number of Americans who are poor by 27 million. (We do not net out the effect of taxes in this way when we calculate the anti-poverty effect of specific benefits or types of benefits, such as Social Security or means-tested benefits.)
[iii] Some people who report receiving both Medicaid and private health insurance received the two forms of health insurance at different times during the year. Others received it at the same time. Medicaid supplements some private insurance by helping low-income families pay for deductibles, co-payments, and premiums for private insurance that the family might otherwise be unable to afford. Medicaid also helps provide some basic medical services that certain private plans may not cover.
[iv] Health insurance for military and other government personnel and their dependents is considered employer-provided health care in this analysis, rather than health care from a public program.
[v] Timothy M. Smeeding, “Children in America: A Comparative View of Our Nation’s Future,” Population Resource Center Congressional Seminar, Washington, DC December 9, 2004.
[vi] Timothy M. Smeeding, “Recent Social Policy Developments in Comparative Perspective: Politics of Poverty and Inequality in America vs. Other Nations.” American Association for the Advancement of Science Congressional Seminar, Washington, DC, May 16, 2005. Smeeding compared the income distributions across a number of western industrialized countries and found that the bottom end of the income distribution for children in the United States fell below the bottom end of that distribution in other countries such as Canada, Belgium, the United Kingdom, and Germany.
[vii] Timothy M. Smeeding, “Recent Social Policy Developments in Comparative Perspective: Politics of Poverty and Inequality in America vs. Other Nations.” American Association for the Advancement of Science Congressional Seminar, Washington, DC, May 16, 2005.
More from the Authors
