Buying Power of Minimum Wage at 51 Year Low
Congress Could Break Record For Longest Period Without an Increase
The minimum wage issue is heating up in Congress. This Congressional attention is long overdue. The federal minimum wage has remained at $5.15 an hour since September 1, 1997. So for nearly nine years the value of the minimum wage has eroded due to the effects of inflation, and the wage standard has fallen further and further behind the wages of other workers.
This lack of Congressional action is approaching an unprecedented stretch. Since the minimum wage was first established in 1938, Congress has typically acted to adjust its level upwards in a more timely fashion. The one exception was in the 1980s, as the minimum wage remained unchanged from January 1981 until April 1990: a period of nine years and three months.
This December 1st will mark nine years and three months since the last increase. Thus, unless Congress acts quickly, so that a federal minimum wage increase is actually put into place before then, on December 2nd the federal minimum wage will have remained at the same level for the longest period since it was established
The lack of action on the minimum wage has led to a dramatic erosion in its value.
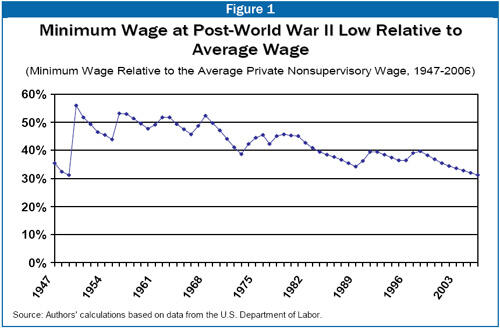
- The minimum wage now equals only 31 percent of the average wage for private sector, nonsupervisory workers. This is the lowest share since at least the end of World War II.
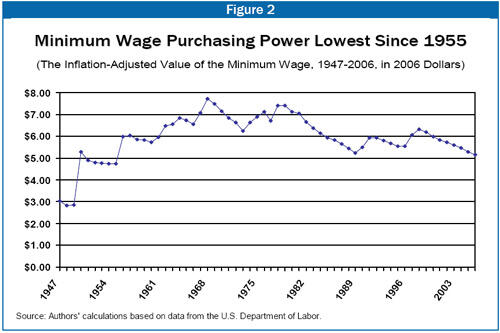
- Since September 1997, the purchasing power of the minimum wage has deteriorated by 20 percent. After adjusting for inflation, the value of the minimum wage is at its lowest level since 1955.
The decline in the value of the minimum wage is part and parcel of a disturbing feature of the recovery from the 2001 recession: its failure to significantly improve the well-being of most workers. Instead, the benefits of our impressive productivity growth rates have largely flowed to those at the top of the income and wealth scale.
These issues are discussed in somewhat more detail below.
Adjustments to the Wage Floor
The federal minimum wage has never included a feature by which it automatically increases each year to ensure that it maintains its purchasing power. As a result, Congress has to act to provide such adjustments.
These adjustments have not always occurred in a timely fashion. Nonetheless, from 1938 to1981, they did occur with enough regularity that the minimum wage generally either rose in purchasing power or remained relatively stable in real value.
Then, as noted, from January 1981 to April 1990 the value of the minimum wage was frozen at $3.35 an hour, the longest period without an adjustment in the wage floor. As a result, the minimum wage eroded markedly in value.
Two series of minimum wage increases took effect in the 1990s, the first of which was signed into law by the senior President Bush. These served to restore some of the lost value of the minimum wage. But the last of that series of increases took effect in September 1997, and the wage floor has not changed since then.
The Current Value of the Minimum Wage
The federal minimum wage has often been set with the level of other workers in mind. This approach reflects the principle that minimum-wage workers should share in economic gains and should not fall too far behind other workers
- During the 1950s and the 1960s, the minimum wage averaged 50 percent — or half — the average wage of workers in nonsupervisory positions.
- The minimum wage has now fallen to 31 percent — or less than one-third — of the average hourly wage for nonsupervisory workers of $16.59 in May. This is the lowest share in the history of this data series, which begins in 1947. (See Figure 1 and Table 1.)[2]
- Research has shown that the fall in the relative value of the minimum wage has contributed to the persistent increase in wage inequality since the latter 1970s.[3]
Another standard for assessing the value of the minimum wage is to track its buying power; that is, to adjust its value to take into account changes in the cost of living. Each year that Congress fails to raise the wage floor its purchasing power erodes. Thus, the fact that the minimum wage has remained the same for nearly nine years means that its real value has declined considerably over this period. As inflation has accelerated recently due to higher energy costs, the real value of the minimum wage has fallen faster.
- The real value of the minimum wage peaked in 1968, when it was equivalent to a wage of $7.71 an hour.[4] During the 1970s, the wage floor averaged $6.90 an hour in today’s dollars. (See Figure 2 and Table 1.)
- Once an adjustment for inflation is taken into account, the purchasing power of the minimum wage has now declined to its lowest level since 1955.
The Imbalanced Recovery
Raising the minimum wage would be one way to help reconnect the living standards of our lowest wage workers to the growth of the overall economy. As has been widely noted, the benefits of the current recovery have failed to reach many workers. Productivity is up sharply, but wages for low-wage workers (as well as for most other workers) have generally stagnated.
For example, for a worker whose wage is at the “10th percentile” (10 percent of workers earn less than this worker; 90 percent earn more), his or her wage level grew consistently in real terms from 1995 to 2002, rising by a total of 16 percent.[5] But from 2002 to 2005, the 10th percentile wage fell by three percent after accounting for inflation, despite the fact that productivity growth is up 10 percent over these years.
Available evidence suggests that it is high-income workers and corporations that are benefiting most from the recovery. For instance, corporate profits receive a larger share of national income than at any time in 39 years.[6]
Given these persistent imbalances, raising the minimum wage is one way to ensure that some small share of the economy’s growth reaches those toiling in the lowest wage jobs in our economy.
| TABLE 1 | |||
| Year | Nominal | Adjusted for Inflation | As a share of average |
| 1947 | $ 0.40 | 3.05 | 35% |
| 1948 | 0.40 | 2.82 | 33% |
| 1949 | 0.40 | 2.86 | 31% |
| 1950 | 0.75 | 5.29 | 56% |
| 1951 | 0.75 | 4.90 | 52% |
| 1952 | 0.75 | 4.82 | 49% |
| 1953 | 0.75 | 4.77 | 47% |
| 1954 | 0.75 | 4.74 | 45% |
| 1955 | 0.75 | 4.75 | 44% |
| 1956* | 0.96 | 6.00 | 53% |
| 1957 | 1.00 | 6.05 | 53% |
| 1958 | 1.00 | 5.88 | 51% |
| 1959 | 1.00 | 5.84 | 50% |
| 1960 | 1.00 | 5.74 | 48% |
| 1961* | 1.05 | 5.97 | 49% |
| 1962 | 1.15 | 6.47 | 52% |
| 1963* | 1.18 | 6.56 | 52% |
| 1964 | 1.25 | 6.85 | 49% |
| 1965 | 1.25 | 6.75 | 48% |
| 1966 | 1.25 | 6.56 | 46% |
| 1967* | 1.39 | 7.08 | 49% |
| 1968* | 1.58 | 7.73 | 52% |
| 1969 | 1.60 | 7.50 | 50% |
| 1970 | 1.60 | 7.16 | 47% |
| 1971 | 1.60 | 6.86 | 44% |
| 1972 | 1.60 | 6.65 | 41% |
| 1973 | 1.60 | 6.26 | 39% |
| 1974* | 1.87 | 6.66 | 42% |
| 1975 | 2.10 | 6.90 | 44% |
| 1976 | 2.30 | 7.15 | 45% |
| 1977 | 2.30 | 6.72 | 42% |
| 1978 | 2.65 | 7.42 | 45% |
| 1979 | 2.90 | 7.43 | 46% |
| 1980 | 3.10 | 7.15 | 45% |
| 1981 | 3.35 | 7.06 | 45% |
| 1982 | 3.35 | 6.67 | 43% |
| 1983 | 3.35 | 6.40 | 41% |
| 1984 | 3.35 | 6.16 | 40% |
| 1985 | 3.35 | 5.96 | 38% |
| 1986 | 3.35 | 5.85 | 38% |
| 1987 | 3.35 | 5.66 | 37% |
| 1988 | 3.35 | 5.46 | 36% |
| 1989 | 3.35 | 5.23 | 34% |
| 1990* | 3.69 | 5.49 | 36% |
| 1991* | 4.14 | 5.95 | 39% |
| 1992 | 4.25 | 5.96 | 39% |
| 1993 | 4.25 | 5.81 | 39% |
| 1994 | 4.25 | 5.69 | 38% |
| 1995 | 4.25 | 5.56 | 37% |
| 1996* | 4.38 | 5.57 | 36% |
| 1997* | 4.88 | 6.09 | 39% |
| 1998 | 5.15 | 6.33 | 40% |
| 1999 | 5.15 | 6.20 | 38% |
| 2000 | 5.15 | 6.00 | 37% |
| 2001 | 5.15 | 5.84 | 35% |
| 2002 | 5.15 | 5.75 | 34% |
| 2003 | 5.15 | 5.62 | 34% |
| 2004 | 5.15 | 5.47 | 33% |
| 2005 | 5.15 | 5.29 | 32% |
| 2006 | 5.15 | 5.15 | 31% |
| * Minimum wage changed during the course of the year; value reflects weighted average for the year. Source: Authors calculations based on data from the U.S. Department of Labor. | |||
End Notes
[1] Jared Bernstein is Director of the Living Standards program at the Economic Policy Institute. Isaac Shapiro is an associate director at the Center on Budget and Policy Priorities.
[2] The table indicates that the minimum wage was also 31 percent of the average private nonsupervisory wage in 1949, apparently the same as currently. This similarity reflects rounding. More precise calculations indicate the minimum wage currently is a slightly smaller share of the average wage than in 1949.
[3] See, for example, David Lee, “Inequality in the United States During the 1980s: Rising Dispersion or Falling Minimum Wage? Quarterly Journal of Economics, 1999, 114(3), 977-1023.
[4] We adjust for inflation using the CPI-RS (research series). The “RS” is a historically consistent series used by many analysts, including the US Bureau of the Census, to adjust for price changes. Relative to the more commonly used CPI-U, the CPI-RS grows more slowly, meaning that the real minimum wage deflated by the CPI-U has a higher peak level: $9.09 in 1968 in today’s dollars. Real values in this report are based on averaging the price index, January through May of this year.
[5] Calculation based on EPI’s hourly wage decile series, see State of Working America, 2004/05.
[6] See: http://www.epi.org/content.cfm/newsflash_060525_gdi