November 1 SNAP Cuts Will Affect Millions of Children, Seniors, and People With Disabilities
State-by-State Figures Highlight the Impacts Across the Country
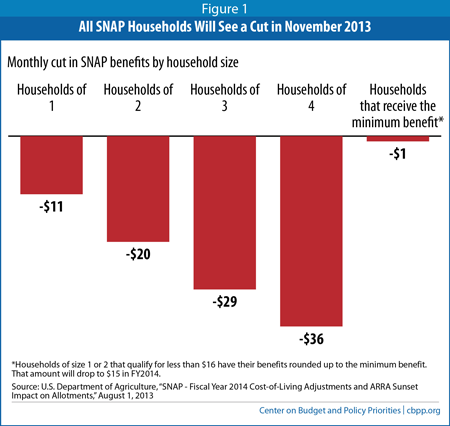
The November 1 benefit cut will be substantial. A household of three, such as a mother with two children, will lose $29 a month — a total of $319 for November 2013 through September 2014, the remaining 11 months of fiscal year 2014. (See Figure 1.) The cut is equivalent to about 16 meals a month for a family of three based on the cost of the U.S. Agriculture Department’s “Thrifty Food Plan.” Without the Recovery Act’s boost, SNAP benefits in fiscal year 2014 will average less than $1.40 per person per meal. Nationally, the cut totals about $5 billion in 2014 and a total of $11 billion over the fiscal year 2014 to 2016 period.[2] (See Table 1.)
The SNAP benefit cut will make it even harder for families to put food on the table. More than 80 percent of SNAP households have monthly income below the federal poverty line ($19,500 a year for a family of three), and more than 40 percent live in deep poverty, with income below half of the poverty line. The Recovery Act’s temporary benefit increase boosted the ability of households to provide adequate food for their families, known as “food security,” research shows.
The benefit cut will affect almost all households that receive SNAP, the majority of which include children, seniors, or people with disabilities. Nationally, more than 21 million children — that is, more than 1 in 4 of all children — live in a household that receives SNAP. At least a quarter of children receive SNAP benefits in more than 30 states and the District of Columbia; in some states, this figure is more than 40 percent. November’s SNAP cut for households with children will total $3.5 billion in the remaining 11 months of fiscal year 2014. Similarly, more than 9 million seniors and people with disabilities receive SNAP. Their households will experience a $1.2 billion benefit cut over the same period. Table 2, below, shows the number of children and senior citizens or people with disabilities in each state who live in such households.
In addition, the November benefit cut will reduce, by millions of dollars in every state but Hawaii, the flow of money that not only would help families afford to eat, but also would inject money into the economy. Studies show that in a distressed economy, every dollar of SNAP benefits creates at least about $1.70 in economic activity, as SNAP recipients spend their benefits on food quickly. For example, California and Texas will each lose over $400 million in SNAP benefits that would have helped their residents eat in 2014; the potential economic impact is even greater.
The depth and breadth of the SNAP cuts that take effect in November are unprecedented. Past cuts have affected specific states or groups, but they have not affected all participants nor been as large as these cuts.
They are taking effect the same week that the House and Senate Agriculture Committees begin their conference committee negotiations on the Farm Bill, which includes a reauthorization of and proposed cuts to SNAP. The House version of the bill would cut SNAP by nearly $40 billion over the next 10 years, denying benefits to about 3.8 million people in 2014 and an average of 3 million people each year over the coming decade.
| Table 1 The SNAP ARRA Termination: Estimated State-by-State Impact in Fiscal Year 2014 | |||
| Total SNAP Benefit Cut to State (in millions of dollars, from November 2013 through September 2014) | Number of SNAP Recipients in FY 2014 (all of whom are impacted by the cut) | ||
| Total | Share of Total State Population | ||
| Alabama | -$98 | 910,000 | 19% |
| Alaska | -$12 | 95,000 | 13% |
| Arizona | -$109 | 1,101,000 | 17% |
| Arkansas | -$52 | 501,000 | 17% |
| California | -$457 | 4,168,000 | 11% |
| Colorado | -$55 | 511,000 | 10% |
| Connecticut | -$44 | 424,000 | 12% |
| Delaware | -$16 | 154,000 | 17% |
| District of Columbia | -$15 | 144,000 | 22% |
| Florida | -$379 | 3,552,000 | 18% |
| Georgia | -$210 | 1,947,000 | 19% |
| Hawaii* | $0 | N/A | N/A |
| Idaho | -$24 | 230,000 | 14% |
| Illinois | -$220 | 2,031,000 | 16% |
| Indiana | -$98 | 925,000 | 14% |
| Iowa | -$43 | 421,000 | 13% |
| Kansas | -$33 | 317,000 | 11% |
| Kentucky | -$94 | 875,000 | 20% |
| Louisiana | -$98 | 920,000 | 20% |
| Maine | -$26 | 251,000 | 19% |
| Maryland | -$82 | 774,000 | 13% |
| Massachusetts | -$95 | 889,000 | 13% |
| Michigan | -$183 | 1,775,000 | 18% |
| Minnesota | -$55 | 556,000 | 10% |
| Mississippi | -$70 | 664,000 | 22% |
| Missouri | -$96 | 933,000 | 15% |
| Montana | -$13 | 131,000 | 13% |
| Nebraska | -$18 | 180,000 | 10% |
| Nevada | -$37 | 359,000 | 13% |
| New Hampshire | -$12 | 117,000 | 9% |
| New Jersey | -$90 | 873,000 | 10% |
| New Mexico | -$47 | 442,000 | 21% |
| New York | -$332 | 3,185,000 | 16% |
| North Carolina | -$166 | 1,708,000 | 17% |
| North Dakota | -$6 | 57,000 | 8% |
| Ohio | -$193 | 1,847,000 | 16% |
| Oklahoma | -$66 | 615,000 | 16% |
| Oregon | -$84 | 819,000 | 21% |
| Pennsylvania | -$183 | 1,779,000 | 14% |
| Rhode Island | -$20 | 181,000 | 17% |
| South Carolina | -$93 | 875,000 | 18% |
| South Dakota | -$11 | 104,000 | 12% |
| Tennessee | -$141 | 1,345,000 | 20% |
| Texas | -$411 | 3,997,000 | 15% |
| Utah | -$26 | 253,000 | 9% |
| Vermont | -$10 | 101,000 | 16% |
| Virginia | -$99 | 941,000 | 11% |
| Washington | -$114 | 1,113,000 | 16% |
| West Virginia | -$36 | 350,000 | 19% |
| Wisconsin | -$89 | 861,000 | 15% |
| Wyoming | -$4 | 39,000 | 7% |
| Guam | -$7 | 45,000 | N/A |
| Virgin Islands | -$4 | 27,000 | N/A |
| Puerto Rico Block Grant | $0 | N/A | N/A |
| Total | -$5,000 | 47,410,000 | 15% |
| Source: CBPP estimates based on USDA’s June 2013 Thrifty Food Plan, CBO May 2013 baseline, 2011 USDA data on SNAP Household Characteristics, recent USDA administrative data on the number of SNAP participants, and U.S. Census Bureau data on state populations. Notes: The number of SNAP recipients shown is for a typical, or average month in fiscal year 2014. In addition to the cuts shown in this table, an additional $6 billion in cuts are expected to occur in fiscal years 2015 and 2016 under CBO’s May 2013 food inflation projections. * We updated this table on January 9, 2014 to accurately reflect the fact that due to higher food inflation in Hawaii, SNAP benefit levels already exceeded the levels set by the Recovery Act in Hawaii, and SNAP participants there did not experience a cut in November. Earlier versions of this paper incorrectly showed that SNAP households in Hawaii would experience a cut. We have not adjusted the national total to reflect this change because the total still rounds to $5 billion. | |||
| Table 2 Estimated State-By-State Impact of the SNAP ARRA Repeal On Subpopulations | ||||||
| Number of Children Affected in FY 2014 | Households With Children Affected in FY 2014 | Benefit Loss to Households With Children (in millions of dollars, November 2013-September 2014) | Number of Elderly or People With Disabilities Affected in FY 2014 | Households With Elderly or People with Disabilities Affected in FY 2014 | Benefit Loss to Households With Elderly or People With Disabilities (in millions of dollars, November 2013-September 2014) | |
| Alabama | 423,000 | 214,000 | -$71 | 157,000 | 144,000 | -$23 |
| Alaska | 42,000 | 18,000 | -$9 | 13,000 | 11,000 | -$2 |
| Arizona | 538,000 | 251,000 | -$84 | 147,000 | 134,000 | -$18 |
| Arkansas | 232,000 | 117,000 | -$37 | 91,000 | 86,000 | -$12 |
| California | 2,285,000 | 1,171,000 | -$373 | 154,000 | 123,000 | -$17 |
| Colorado | 250,000 | 117,000 | -$41 | 73,000 | 69,000 | -$10 |
| Connecticut | 149,000 | 77,000 | -$24 | 102,000 | 94,000 | -$15 |
| Delaware | 68,000 | 34,000 | -$11 | 23,000 | 21,000 | -$3 |
| District of Columbia | 55,000 | 28,000 | -$9 | 30,000 | 27,000 | -$4 |
| Florida | 1,303,000 | 668,000 | -$215 | 713,000 | 666,000 | -$92 |
| Georgia | 892,000 | 441,000 | -$152 | 295,000 | 260,000 | -$36 |
| Hawaii* | 0 | N/A | N/A | N/A | N/A | N/A |
| Idaho | 117,000 | 55,000 | -$19 | 35,000 | 32,000 | -$5 |
| Illinois | 886,000 | 425,000 | -$145 | 349,000 | 322,000 | -$47 |
| Indiana | 436,000 | 212,000 | -$74 | 164,000 | 153,000 | -$22 |
| Iowa | 174,000 | 87,000 | -$27 | 69,000 | 60,000 | -$8 |
| Kansas | 148,000 | 72,000 | -$23 | 51,000 | 50,000 | -$6 |
| Kentucky | 343,000 | 177,000 | -$59 | 207,000 | 189,000 | -$28 |
| Louisiana | 436,000 | 209,000 | -$71 | 174,000 | 162,000 | -$24 |
| Maine | 94,000 | 52,000 | -$15 | 67,000 | 60,000 | -$9 |
| Maryland | 301,000 | 154,000 | -$46 | 147,000 | 128,000 | -$17 |
| Massachusetts | 334,000 | 184,000 | -$50 | 283,000 | 253,000 | -$36 |
| Michigan | 769,000 | 394,000 | -$131 | 461,000 | 409,000 | -$67 |
| Minnesota | 239,000 | 112,000 | -$33 | 114,000 | 104,000 | -$10 |
| Mississippi | 307,000 | 148,000 | -$49 | 119,000 | 112,000 | -$15 |
| Missouri | 449,000 | 218,000 | -$71 | 188,000 | 175,000 | -$22 |
| Montana | 55,000 | 29,000 | -$9 | 24,000 | 21,000 | -$3 |
| Nebraska | 89,000 | 41,000 | -$14 | 35,000 | 32,000 | -$4 |
| Nevada | 167,000 | 77,000 | -$24 | 63,000 | 59,000 | -$7 |
| New Hampshire | 49,000 | 26,000 | -$7 | 33,000 | 28,000 | -$4 |
| New Jersey | 364,000 | 184,000 | -$56 | 195,000 | 167,000 | -$24 |
| New Mexico | 217,000 | 106,000 | -$34 | 62,000 | 56,000 | -$8 |
| New York | 1,211,000 | 649,000 | -$207 | 1,064,000 | 944,000 | -$163 |
| North Carolina | 758,000 | 389,000 | -$118 | 285,000 | 246,000 | -$31 |
| North Dakota | 29,000 | 15,000 | -$5 | 13,000 | 12,000 | -$2 |
| Ohio | 792,000 | 402,000 | -$142 | 412,000 | 378,000 | -$57 |
| Oklahoma | 294,000 | 145,000 | -$49 | 116,000 | 106,000 | -$13 |
| Oregon | 304,000 | 164,000 | -$45 | 159,000 | 138,000 | -$16 |
| Pennsylvania | 766,000 | 366,000 | -$120 | 494,000 | 440,000 | -$68 |
| Rhode Island | 64,000 | 36,000 | -$11 | 46,000 | 42,000 | -$6 |
| South Carolina | 401,000 | 200,000 | -$66 | 142,000 | 127,000 | -$17 |
| South Dakota | 52,000 | 24,000 | -$8 | 20,000 | 18,000 | -$3 |
| Tennessee | 560,000 | 278,000 | -$95 | 252,000 | 224,000 | -$29 |
| Texas | 2,360,000 | 1,085,000 | -$342 | 672,000 | 609,000 | -$95 |
| Utah | 151,000 | 64,000 | -$22 | 38,000 | 34,000 | -$5 |
| Vermont | 34,000 | 19,000 | -$5 | 28,000 | 24,000 | -$4 |
| Virginia | 415,000 | 211,000 | -$68 | 174,000 | 160,000 | -$18 |
| Washington | 456,000 | 231,000 | -$67 | 234,000 | 208,000 | -$27 |
| West Virginia | 141,000 | 75,000 | -$23 | 98,000 | 87,000 | -$11 |
| Wisconsin | 379,000 | 190,000 | -$53 | 164,000 | 148,000 | -$20 |
| Wyoming | 17,000 | 9,000 | -$3 | 6,000 | 6,000 | -$1 |
| Guam | 26,000 | 10,000 | -$6 | 3,000 | 2,000 | -$1 |
| Virgin Islands | 12,000 | 6,000 | -$3 | 4,000 | 3,000 | -$1 |
| Total | 21,430,000 | 10,667,000 | -$3,442 | 9,061,000 | 8,166,000 | -$1,185 |
| Source: CBPP estimates based on USDA’s June 2013 Thrifty Food Plan, CBO May 2013 baseline, 2011 USDA data on SNAP Household Characteristics, recent USDA administrative data on the number of SNAP participants, and U.S. Census Bureau data on state populations. Notes: The number of SNAP recipients shown is for a typical, or average month in fiscal year 2014. *This table was updated on January 9, 2014 to reflect the fact that due to higher food inflation in Hawaii, SNAP benefit levels already exceeded the levels set by the Recovery Act in Hawaii, and SNAP participants there did not experience a cut in November. Earlier versions of this paper incorrectly showed that SNAP households in Hawaii would experience a cut. | ||||||
End Notes
[1] We updated this paper on January 9, 2014 to accurately reflect that SNAP participants in Hawaii did not experience a decrease in benefits. The U.S. Agriculture Department sets SNAP benefits for Alaska, Hawaii, Guam, and the Virgin Islands differently from the rest of the United States because the cost of food is different in these areas. Hawaii’s Thrifty Food Plan exceeded the Recovery Act levels beginning in fiscal year 2013, and therefore its SNAP benefits were already set higher than Recovery Act levels. Earlier versions of this paper incorrectly estimated that SNAP recipients in Hawaii would see a benefit cut. SNAP households in Alaska, Guam, and the Virgin Islands experienced a benefit cut in November 2013 that was the same in proportional terms, but slightly different in dollar terms, from the cut in the 48 other states and the District of Columbia.
[2] For more information on the temporary benefit boost, see Stacy Dean and Dorothy Rosenbaum, “SNAP Benefits Will Be Cut for All Participants in November 2013,” Center on Budget and Policy Priorities, Revised August 2, 2013, https://www.cbpp.org/cms/index.cfm?fa=view&id=3899.
More from the Authors

Areas of Expertise