Comparison of Benefits for Poor Families to Middle-Class Incomes Is Deeply Flawed
Senator Jeff Sessions (R-AL) recently posted to the Senate Budget Committee website a document that implies that programs targeted to low-income people provide lavish benefits that raise the typical poor household’s standard-of-living above that of the typical middle-income household.[1] The Sessions release, however, is deeply flawed; it substantially overstates the assistance that poor households receive. Means-tested programs do not raise poor households anywhere close to a typical middle-income household’s standard of living.
The Sessions document derives its numbers by adding up the cost of a large number of programs that are targeted on low- and moderate-income households — or on schools and communities with large numbers of low- and moderate-income students or residents — and dividing the total cost of these programs (all of which it labels “welfare”) by the number of households below the official poverty line. It claims this shows that we spend the equivalent of $168 per poor household per day — or more than $60,000 per poor household annually. It then compares this per-household amount to median household income.
This comparison rests, however, on a series of serious manipulations of the data that violate basic analytic standards and are used to produce a potentially inflammatory result. To produce its claims, the document Senator Sessions posted does the following:[2]
-
Counts payments to hospitals, doctors, nursing homes, and other medical providers — including payments for care for sick elderly people at the end of their lives and for people with serious disabilities who are institutionalized — as though these payments are akin to cash income that is going to poor families to live on. The single largest area of federal spending in the Sessions comparison is health care spending. Close to half of all of the spending that Senator Sessions portrays as income to poor households consists of payments to hospitals, doctors, and other health care providers through Medicaid, the Children’s Health Insurance Program (CHIP), or smaller health programs. The majority of this health care spending is for the elderly or people with disabilities, including end-of-life care and nursing home care.
The Sessions analysis improperly treats medical spending as though it were akin to a cash benefit allocated across all poor households and available for spending on expenses such as rent and food. Expenditures for things like nursing home care or care in an intensive-care unit in a hospital is extremely expensive, but it does not represent benefits available to a typical low-income household to live on.
Aggravating these problems, the Census data on the number of poor households in the United States — which Senator Sessions uses to come up with his figure of the amount spent per poor household — does not include people in nursing homes or other long-term care institutions. That is, while he includes spending on institutional care, those receiving it are not in the count of poor households. Moreover, much of Medicaid spending for long-term care is for people who were middle class for most of their lives but whose long-term care expenses now outstrip their savings. (Medicaid pays for about 40 percent of all long-term care spending in the United States.[3] ) Thus, Senator Sessions counts tens of billions of dollars in long-term care expenditures for formerly middle-class people now living in nursing homes — people whom the Census Bureau does not count as poor — as though these expenditures are tantamount to income that goes to poor people and raises their standard of living. He uses these misclassified billions of dollars in expenditures to help portray poor households as getting more resources than middle-class families.
-
Counts, as spending on poor people, benefits and services that go to families and individuals who are above the poverty line. As noted, Senator Sessions divides the cost of a broad set of programs by the number of households with income below the official poverty line. Yet many of these programs, by design and for good reason, serve substantial numbers of low- and moderate-income Americans whose incomes are above the poverty line. For example, 65 percent of the lower-income working households receiving the Earned Income Tax Credit (EITC) in 2011 had incomes above the official poverty line. Many programs do not cut off benefits abruptly at the poverty line, for two reasons. First, many hard-pressed families and individuals modestly above the poverty line have significant needs; for example, an elderly widow living on only $12,000 a year is above the poverty line. Second, abruptly cutting off benefits at the poverty line, rather than phasing them down gradually as income rises, would create large work disincentives.
Nevertheless, the Sessions analysis takes all means-tested assistance that goes to households above the poverty line and includes it in the spending total that it divides by the number of people below the poverty line, thereby further inflating the supposed amount per poor household.
- Counts the value of health coverage for low-income households but not for middle-income households. Finally, when the Sessions analysis compares its figure for the benefits that poor households receive to median household income, it ignores the employer-provided benefits — most notably, employer-sponsored health insurance — that many middle-income households receive. Senator Sessions thus counts the value of the main source of health care coverage for low-income people, while excluding the value of employer-provided health care for middle-income workers.
Census data paint a very different picture. The Census Bureau’s Supplemental Poverty Measure (SPM) — which counts non-cash and tax-based benefits as income, including the Supplemental Nutrition Assistance Program (SNAP, formerly Food Stamps), refundable tax credits, housing subsidies and the like, but not medical care — shows that:
- In 2011, the typical person in a family whose income was below the poverty line before means-tested benefits are counted remained12 percent belowthe poverty line after the means-tested benefits are counted. Moreover, the Supplemental Poverty Measure shows that even with these benefits, the typical poor person’s standard of living is 57 percent below that of the typical middle-income American.[4]
- The SPM also shows that means-tested benefits lifted 20 million people out of poverty in 2011, but that the typical individual lifted out of poverty had income only 16 percent above the poverty line, far below the income level of the typical middle-class person.
We now examine these problems with the Sessions document in more detail.
Treatment of Health Care
A very large share of means-tested health spending is for seniors and people with disabilities. Although they made up only 25 percent of Medicaid and CHIP beneficiaries in 2009,[6] fully 66 percentof Medicaid spending went for care for these groups. Providing care to a frail elderly person or a person with a disability costs much more than the typical cost of care for a child or a working-age parent.[7]
Long-term care alone constitutes 28 percent of all Medicaid costs[8] — and a larger share of Medicaid costs for seniors and people with disabilities. A substantial share of Medicaid spending on long-term care is for seniors who had middle-class incomes for much of their working lives but whose long-term care needs now exceed their ability to pay for that care. In 2010, private nursing home care averaged $83,585 per year, assisted living facility costs averaged $39,516 per year, and home health aide services averaged $21 per hour. In 2009, the average long-term care cost for a Medicaid beneficiary receiving such care was $34,579, a figure sure to be somewhat higher today. [9]
By including the costs of such care in the calculation of the average spending per poor household, the Sessions analysis creates a misleading impression that typical low-income families and children receive extravagant benefits. Providing a frail senior with nursing home care does not mean that the typical low-income family with children is receiving huge amounts of benefits that give it a high standard of living.
Aggravating this problem, while the Sessions piece includes the cost of health benefits targeted on lower-income individuals, it fails to take into account the value of employer-provided health care coverage. Many middle-income households receive employer-provided coverage with a sizable contribution from the employer toward the cost of that coverage. Sessions ignores this in the figure he uses for “median household income.”
We strongly caution, however, against including health benefits in a comparison that purports to describe the income available to families (at any income level) to meet their basic expenses; it is more useful to consider the income available for expenses such as food and housing and to consider separately whether a family has affordable health insurance. Trying to convert the worth of health insurance to “income” produces very odd results, in part because the amount of health care that individuals consume varies very widely, and higher consumption often reflects poorer health status, not greater affluence.
Older people, people with disabilities, and people with serious illnesses incur far higher health care costs than do healthy individuals, but that doesn’t make them “higher income” or give them a higher standard of living than healthier households have. Similarly, a low-income family with a child who has a serious disability is not “well off” because Medicaid covers the child’s sizable health care costs. A middle-income household with a member fighting cancer doesn’t suddenly become “high income” when the family’s insurance covers costly cancer treatments.
Health care programs represent 46 percent of all federal means-tested spending that the Sessions analysis counts. Had the analysis appropriately excluded health care spending from both sides of its comparison, rather than counting it for poor households while ignoring it for middle-class households, its figure for the amount of means-tested expenditures made on behalf of the average poor household would shrink nearly in half.[10] The figure shrinks further if corrections are made to address the other serious deficiencies we identify here.
By Design, Income-Targeted Programs Are Not Limited to People in Poverty
The Sessions analysis ignores the fact that many of the individuals and families whom low-income programs serve have incomes somewhat above the poverty line.[11] It treats all of the benefits that go to households with annual incomes above the poverty line as though they were expenditures made on behalf of households with incomes below the poverty line, substantially inflating the figures on the amount of benefits provided per poor household.
Census data show that in 2011, a majority of families in which someone received at least one of the major means-tested benefits that the Sessions analysis counts had annual cash income above the official poverty line. (For this analysis, we considered Temporary Assistance for Needy Families [TANF], SNAP, refundable tax credits, Medicaid, CHIP, Supplemental Security Income [SSI], housing assistance, energy assistance, WIC, and free or reduced-price school meals[12] .)
There are two main reasons why many non-poor families receive assistance. First, some programs have eligibility limits that exceed the poverty line, in recognition of the fact that many near-poor or other modest-income families and individuals have need for certain types of assistance. These eligibility limits also allow various benefits to phase out as income rises rather than to end abruptly at the poverty line, which would create a large work disincentive “cliff.” For example, reduced-price school lunches are available to children up to 185 percent of the poverty line. The EITC phases out at 205 percent of the poverty line for a two-parent, two-child family in 2013. In many states, CHIP serves children from families with income up to 250 percent or 300 percent of the poverty line.[13] Pell Grants also serve an income range that extends significantly above the poverty line.
Second, some families receive assistance for part of the year when their incomes drop temporarily, such as when a parent loses a job or a marriage falls apart. Families often qualify for assistance for several months until they get back on their feet, and then cease to qualify for assistance. Many such families thus are poor during the months that they receive assistance, but have incomes for the calendar year as a whole that are above the poverty line.<
The Sessions analysis includes the benefits that all such families receive in the “numerator” of its fraction — that is, in its total dollar amount of means-tested benefit expenditures. But the Sessions piece fails to includethese families in the “denominator” of its fraction — the number of poor households — because their annualincome shows up in the Census data as being above the poverty line, and hence they are not considered “poor.”
Congress has designed programs to provide various supports to families with annual incomes modestly above the poverty line for sound policy reasons.
- The poverty line is low. In 2012, the Census Bureau’s official poverty measure considers an elderly widow to be poor if her income is below $11,011. An elderly individual living on $225 per week — $11,700 a year — would not be considered poor. Similarly, under the official Census poverty definition, a single parent raising two children on $18,500 in 2012 would not be considered poor.
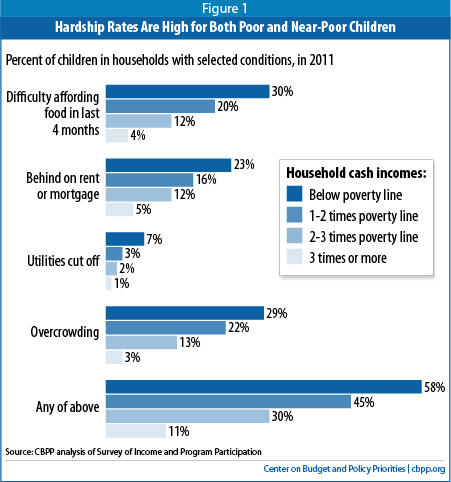
- Data show that many near-poor families face material hardship. Census data include information on the extent to which households experience various types of hardship, including difficulty affording adequate food (what the Agriculture Department terms “food insecurity”); falling behind on rent or mortgage payments; having gas, oil, or electrical service cut off; or living in what the Department of Housing and Urban Development considers overcrowded conditions (more than one person per room; see Figure 1). In 2011, some 58 percent of children whose households had cash income below the poverty line lived in households that reported one or more such difficulties. But so did 45 percent of children in households with incomes between 100 percent and 200 percent of the poverty line, and 30 percent of children in households between two and three times the poverty line.[14] These data suggest that while hardships and economic need are highest for the poor, they remain fairly widespread among those modestly above the poverty line.
- Benefits such as Pell Grants and child care assistance promote education and employment, and many families above the poverty line need such assistance to be able to send a student to college or pay for child care. The costs of college tuition and child care are high, and without assistance, many near-poor families — not just people below the poverty line — would find them out of reach. A mother whose earnings place her modestly above the poverty line for a family of three and who is raising two children is unlikely to be able to afford $7,600 for child care (the cost of full-time care for a 4 year old in the median state) or more than $8,000 for college tuition.[15] Those expenses would come on top of the $16,000 that the average household in the lowest income quintile spends on food, housing, clothing, and transportation.[16]
-
Assisting families with incomes modestly above the poverty line promotes work and helps working families make ends meet. Over the past half-century, policymakers have determined on a bipartisan basis that to encourage work and help low-wage workers with children make ends meet, benefits should not stop abruptly at the poverty line. Experts often point out that reducing assistance too quickly as families gain a toehold in the labor market and begin to work can create significant disincentives to work more hours or seek a promotion and a pay raise.[17] That is a key reason why benefits such as SNAP phase out gradually as earnings rise and why the EITC increases as workers’ earnings rise from very low levels.
Recent research has shown that the safety net as a whole has only small work disincentive effects and that some programs significantly increase work among poor adults. Numerous studies have found that the EITC increases the number of low-income parents who work.[18] While policymakers often point to the 1996 welfare law’s creation of TANF as the primary reason for increased work among single mothers since the mid-1990s, the research literature indicates that the expansions of the EITC in the 1990s did as much (or more) than the welfare law to produce these gains (see Figure 2).[19] Research also shows that by boosting employment among single mothers, the EITC has produced large declines in the receipt of cash welfare assistance.[20]
Finally, it should be noted that while the Sessions analysis includes the EITC (as well as the Child Tax Credit) as means-tested benefits, it fails to subtract out the payroll taxes that low-income households pay. The EITC was designed in part to offset these taxes — the Sessions analysis ignores this and includes the full cost (of the refundable portion) of the EITC.
Analysis Makes Flawed Comparison of Means-Tested Benefits to Median Income
By comparing spending on targeted benefits to median household income, the Sessions analysis may be read to imply that low-income families don’t work and have no earnings or wages. That’s not correct. In 2011, 80 percent of households headed by someone below 200 percent of the official poverty line who wasn’t elderly or disabled had earnings from work.[21]
Similarly, the comparison may be read to imply that middle-income families receive all of their income from earnings and don’t receive benefits from public programs. That’s incorrect, as well. In 2010, households in the middle 60 percent of the income distribution received 58 percent of the more than $1 trillion in federal entitlement benefits (including Medicare and Social Security[22] ).
Census Data Belie the Impression the Sessions’ Document Seeks to Foster
Census data show that federal benefit programs that are targeted on low-income households to help them meet basic needs significantly reduce the incidence and depth of poverty. As noted above, the federal government has developed a Supplemental Poverty Measure (SPM) that most analysts favor because it represents a more comprehensive measure of poverty. Unlike the official poverty measure, the SPM counts various non-cash benefits such as SNAP and rental subsidies as income because they can be used to pay for such things as food, clothing, shelter, and utilities. It also takes into account the taxes families pay and the refundable tax credits they receive (as well as differences in the cost of living across the country).[23]
Based on the SPM, means-tested programs lifted 20 million people out of poverty in 2011 and reduced the severity of poverty for 36 million others. (The EITC had the largest anti-poverty impact for children; in 2011, the EITC and Child Tax Credit together lifted 9.4 million people, including nearly 5 million children, out of poverty. SNAP kept 4.7 million people above the poverty line, including 2.1 million children. SNAP also did more than any other program to keep children out of deep poverty, raising 1.5 million children above half of the SPM poverty line in 2011.)
But the SPM also shows that means-tested benefits aren’t lavish. In 2011, the typical person in a family whose income was below the poverty line before means-tested benefits are counted remained 12 percent below the poverty line after counting the non-health means-tested benefits (including SNAP, housing assistance, SSI, cash welfare assistance, and the EITC, among others). Moreover, these benefits left this low-income individual 57 percent below the living standard of the typical middle-income American.[24] And, those who are lifted out of poverty by these benefits generally still have modest incomes: the typical person whom the benefits lifted above the poverty line had total income, including these benefits, only 16 percent above the poverty line, as measured by the SPM.
Finally, though programs such as the EITC and SNAP lift millions of families and children out of poverty, the U.S. safety net remains less robust than that in most other Western countries. Most other similarly affluent countries have lower rates of poverty than we do (using a widely recognized international poverty measure) after factoring in the impact of social programs — even though their poverty rates before counting social programs are similar to ours. Stated another way, the U.S. poverty rate is near the average among Western countries before taking government social programs and taxes into account. But once benefits from social programs and the effects of taxes are factored in, the United States lags behind the other countries and has a significantly higher rate of poverty than they do, because government policies do considerably more to reduce poverty in the other countries than they do here. Social programs in other Western nations tend to be more generous, broader in scope, and easier to access.[25]
End Notes
[1] Senator Jeff Sessions, “Total Welfare Spending Equates To $168 Per Day For Every Household In Poverty,” United States Senate Committee on the Budget — Republicans December 7, 2012, http://budget.senate.gov/republican/public/index.cfm/budget-background?ID=f1f23669-79fb-4a25-bafc-6a28f82f9c75.
[2] Sessions.
[3] Kaiser Commission on Medicaid and the Uninsured, “Medicaid’s Role in Meeting the Long-Term Care Needs of America’s Seniors,” January 2013, http://www.kff.org/medicaid/upload/8403.pdf.
[4] To account for differences in family size, “standard of living” in this analysis is defined as income as a percent of the poverty line. (This is a standard way of measuring income and adjusting for family size differences.) Using the Census Bureau’s Supplemental Poverty Measure (SPM) income definition, the typical poor person had income after benefits were counted equal to 88 percent of the SPM poverty line. The median person, by contrast, lived in a family with income equal to 207 percent of the SPM poverty line.
[5] In accordance with the recommendations of a National Academy of Sciences panel, the SPM does not count Medicaid or other medical benefits as income; it subtracts out-of-pocket medical expenses from its measure of family resources. Families with Medicaid tend to have considerably lower out-of-pocket medical expenses than do other low-income families, who may be uninsured or face substantial cost-sharing requirements.
[6] Kaiser Commission on Medicaid and the Uninsured and Urban Institute estimates based on data from FY 2009 Medicaid Statistical Information System (MSIS), 2012, http://www.statehealthfacts.org/comparemaptable.jsp?typ=1&ind=200&cat=4&sub=52.
[7] Kaiser Commission on Medicaid and the Uninsured and Urban Institute estimates based on data from 2009 MSIS and CMS-64 reports, 2012, http://www.statehealthfacts.org/comparemaptable.jsp?typ=4&ind=858&cat=4&sub=47.
[8] Center on Budget and Policy Priorities analysis of 2011 CM-64 reports.
[9] Medicaid’s Role in Meeting the Long-Term Care Needs of America’s Seniors, www.kff.org/medicaid/upload/8403.pdf.
[10] CBPP analysis of Congressional Research Service “Spending for Federal Benefits and Services for People with Low Income, F&2008-FY2011: An Update of Table B-1 from CRS Report R41625, Modified to Remove Programs for Veterans,” October 16, 2012, http://budget.senate.gov/republican/public/index.cfm/files/serve/?File_id=0f87b42d-f182-4b3d-8ae2-fa8ac8a8edad.
[11] The federal poverty line for a family of three is currently $19,530. Here we refer to the Department of Health and Human Services poverty guidelines for a family of three for the 48 contiguous states, which are used in setting eligibility for various means-tested programs. See “Annual Update of the HHS Poverty Guidelines,” Federal Register, January 24, 2013, https://www.federalregister.gov/articles/2013/01/24/2013-01422/annual-update-of-the-hhs-poverty-guidelines#t-1.
[12] CBPP analysis of March 2012 Current Population Survey. This analysis includes unrelated individuals as one-person families.
[13] Martha Heberlein et al., “Getting into Gear for 2014: Findings from a 50-State Survey of Eligibility, Enrollment, Renewal, and Cost-Sharing Policies in Medicaid and CHIP, 2012-2013”Henry J. Kaiser Family Foundation, 2013.
[14] CBPP analysis of U.S. Census Bureau data from the Survey of Income and Program Participation. Poverty is based on annual household cash income below the traditional federal poverty threshold. For more information on the method used to measure hardship, see U.S. Department and Health and Human Services, Measures of Material Hardship (2004), at http://www.kff.org/medicaid/upload/8403.pdf.
[15] “Trends in College Pricing,” College Board Advocacy & Policy Center, http://trends.collegeboard.org/sites/default/files/college-pricing-2012-full-report_0.pdf.
[16] CBPP calculations of data for all consumer units in the bottom quintile of the consumption expenditure distribution “Table 1. Quintiles of income before taxes: Average annual expenditures and characteristics, Consumer Expenditure Survey, 2011,” Bureau of Labor Statistics, September 2012, ftp://ftp.bls.gov/pub/special.requests/ce/standard/2011/quintile.txt.
[17] For more on this view and an overview of research showing that existing safety net programs have very modest work and earnings disincentives, see Robert Greenstein, “Testimony before the House Budget Committee Hearing on Strengthening the Safety Net,” Center on Budget and Policy Priorities, April 17, 2012, https://www.cbpp.org/cms/index.cfm?fa=view&id=3745.
[18] For a summary of research on the EITC, see V. Joseph Hotz and John Karl Scholz, “The Earned Income Tax Credit,” in Robert A. Moffitt, ed., Means-Tested Transfer Programs in the United States (Chicago: The University of Chicago Press, 2003); Bruce D. Meyer and Dan T. Rosenbaum, “Making Single Mothers Work: Recent Tax and Welfare Policy and its Effects,” in Bruce D. Meyer and Douglas Holtz-Eakin, eds., Making Work Pay: The Earned Income Tax Credit and Its Impact on America’s Families (New York: Russell Sage Foundation, 2001); Bruce D. Meyer and Dan T. Rosenbaum, “Welfare, The Earned Income Tax Credit, and the Labor Supply of Single Mothers,” Quarterly Journal of Economics 116(3): 1063-2014; Nada Eissa and Hilary Hoynes, “Behavioral Responses to Taxes: Lessons from the EITC and Labor Supply,” October 10, 2005, http://www.kff.org/medicaid/upload/8403.pdf.
[19] Jeffrey Grogger, “The Effects of Time Limits, the EITC, and Other Policy Changes on Welfare Use, Work, and Income among Female-Head Families,” Review of Economics and Statistics, May 2003.
[20] Stacy Dickert, Scott Houser, and John Karl Scholz, “The Earned Income Tax Credit and Transfer Programs: A Study of Labor Market and Program Participation,” Tax Policy and the Economy, Vol. 9, MIT Press, 1995; Jeffrey Grogger 2003. Using different data, in another study, Grogger reaches similar conclusions. Jeffrey Grogger, “Welfare Transitions in the 1990s: the Economy, Welfare Policy, and the EITC,” NBER Working Paper No. 9472, January 2003, http://www.nber.org/papers/w9472.pdf.
[21] CBPP analysis of March 2012 Current Population Survey.
[22] Arloc Sherman, Robert Greenstein, and Kathy Ruffing, “Contrary to ‘Entitlement Society’ Rhetoric, Over Nine-Tenths of Entitlement Benefits Go to Elderly, Disabled, or Working Households,” Center on Budget and Policy Priorities, February 10, 2012, https://www.cbpp.org/cms/index.cfm?fa=view&id=3677.
[23] The measure also makes adjustments in the poverty line, particularly in parts of the country where housing costs are high, and it deducts necessary work expenses and out-of-pocket medical expenses from income. In 2011, under this more comprehensive poverty measure, some 50 million people had incomes below the poverty line, which was set at about $25,000 for an average family of four.
[24] CBPP calculations of the March 2012 Current Population Survey. Note that survey-based estimates such as these tend to understate the value of income from government benefits and other sources because participating households may forget or underreport some income sources. For some benefits, corrected data are available from the TRIM microsimulation model that the Urban Institute developed and maintains for the Department of Health and Human Services. The latest year for which TRIM data are available is 2009. When we repeat the analysis using 2009 TRIM-based figures for SNAP, TANF, and SSI, our estimates show that counting means-tested income assistance raises the incomes of otherwise-poor recipients to 4 percent below the poverty line, compared with 10 percent below the poverty line in the uncorrected SPM figures for 2009 — a small difference.
[25] OECD, Growing Unequal? Income Distribution and Poverty in OECD Countries, 2008, http://www.oecd.org/els/socialpoliciesanddata/growingunequalincomedistributionandpovertyinoecdcountries.htm. See also, Indivar Dutta-Gupta, “Taking Stock of the Safety Net, Part 6: It Works, But It Doesn’t Do Enough,” Off the Charts blog, December 21, 2011, http://www.offthechartsblog.org/taking-stock-of-the-safety-net-part-6-it-works-but-it-doesnt-do-enough/.
More from the Authors

Areas of Expertise


Areas of Expertise
