BEYOND THE NUMBERS
The War on Poverty at 50, Illustrated
Wednesday marks the 50th anniversary of President Johnson’s War on Poverty. As we mark this anniversary, we should recognize that poverty has fallen significantly over the last half-century when measured using a comprehensive poverty measure, and other troubling poverty-related conditions have declined. Nevertheless, poverty and hardship remain high, with millions of Americans having trouble putting food on the table and a roof over their heads.
Our new chart book illustrates these trends, along with the factors that have affected poverty over the last 50 years.
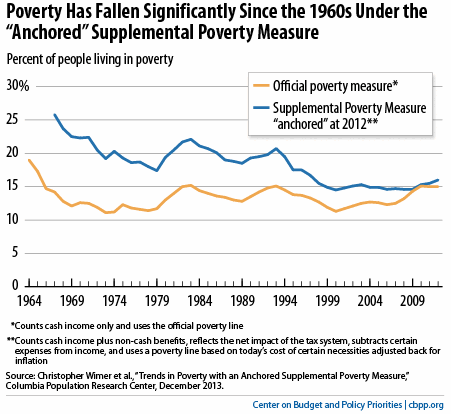
We released the first two sections of the chart book today. Section 1 examines how we measure poverty and explains that more complete poverty and income measures, such as the Census Bureau’s Supplemental Poverty Measure, show the progress that’s been made in fighting poverty over the last 50 years.
Section 2 shows how a much stronger safety net along with factors such as rising education levels, higher employment among women, and smaller families helped push poverty down (see chart).
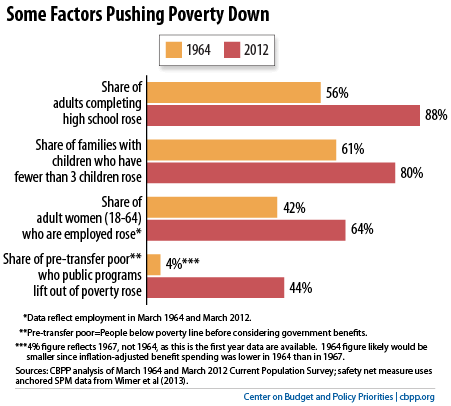
At the same time, growing income inequality, rising numbers of single-parent families, and worsening labor market prospects for less-skilled workers have pushed in the other direction.
We’ll dive deeper into each of these sections of the chart book in future posts. Additional sections of the chart book will take a closer look at the positive effects of the safety net and trends in the labor market and inequality.
Click here for the first two sections of the chart book.