BEYOND THE NUMBERS
The Top 5 (Okay, 6) State Tax Charts
As we approach Tax Day, here are six charts focusing on state taxes.
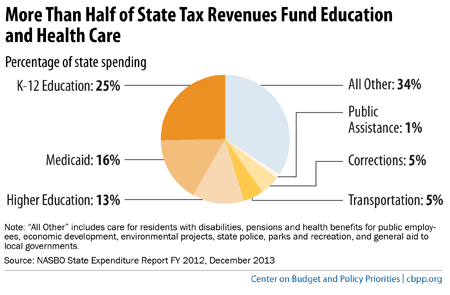
More than half of state tax dollars go to fund education (K-12 and higher education) and health care, as the chart below shows. State tax dollars also fund other critical services such as transportation, corrections, public assistance, care for residents with disabilities, police, state parks, and general aid to local governments.
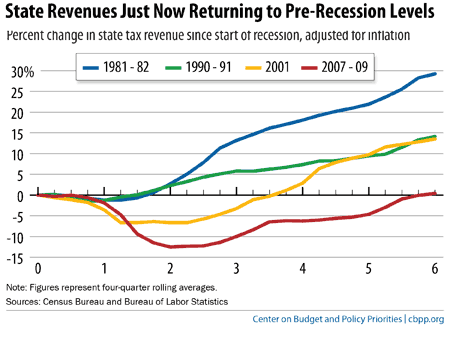
State revenue losses from the Great Recession were both deeper and longer lasting than in previous recessions, as the chart below shows. Not until the end of 2013 did revenues finally return to pre-recession (2007) levels, after adjusting for inflation. But, the steady revenue increases of recent years offer states an opportunity to reinvest in education and other services that sustained unprecedented cuts during the recession.
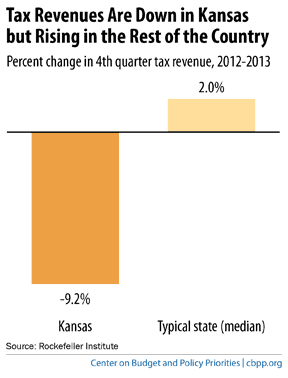
While revenues have slowly recovered in most states, Kansas has moved in the opposite direction, as the chart below shows. Kansas slashed income taxes, especially for businesses and wealthy Kansans, even as needs — like the number of K-12 students — have grown. Revenues fell by more than 9 percent in Kansas in 2013. Meanwhile, there is no evidence that the tax cuts have boosted the Kansas economy.
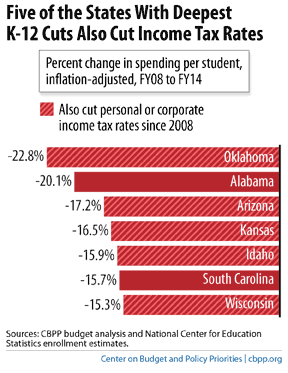
Five of the seven states that have made the deepest cuts to K-12 education since the beginning of the recession have also enacted major income tax cuts, as the chart below shows. These tax cuts eliminated revenue that could have helped states reverse the deep funding cuts from the recession and invest in promising education reforms.
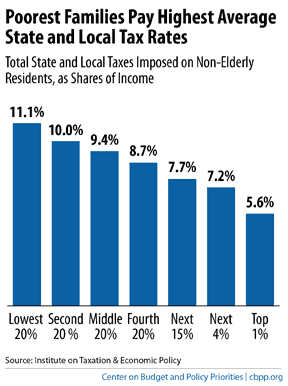
As the chart below shows, low-income families pay significantly more of their income in state and local taxes than very wealthy families. State and local taxes push many families into — or deeper into — poverty.
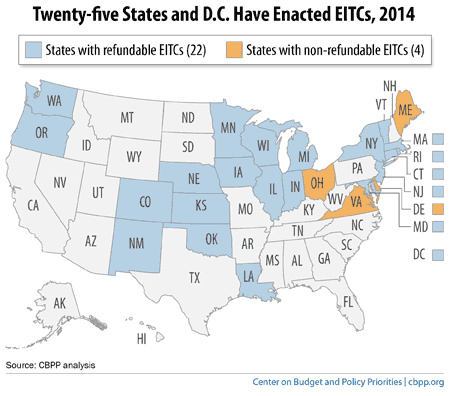
A state Earned Income Tax Credit (EITC) is one powerful tool to prevent state and local taxes from pushing low-income working families deeper into poverty. Twenty-five states and Washington, DC, have their own EITCs, as the map below shows. A state credit builds on the federal EITC’s proven effectiveness in helping low-income working families make ends meet. States looking to encourage work and reduce poverty, especially among children (the federal EITC lifts more children out of poverty than any other program), should considering enacting or expanding an EITC.