BEYOND THE NUMBERS
TANF Shows Why Block Grants Are Bad Deal for States
As we’ve explained, some states would face disproportionally large cuts if policymakers converted Medicaid from an entitlement in which federal spending rises to accommodate rising need to a block grant or per capita cap, as the House and Senate bills to repeal the Affordable Care Act (ACA) would do. The Temporary Assistance for Needy Families (TANF) block grant shows why states should take this concern seriously.
When President Clinton and Congress replaced the Aid to Families with Dependent Children (AFDC) entitlement, which served poor families with children, with the TANF block grant in 1996, they based the block grant allocations to the states on states’ historic spending under AFDC and related programs. Measured in relation to the number of poor children in each state, the allocations were inequitable from the start and have grown more so over time.
The House and Senate ACA repeal bills would both replicate the same initial inequity. In addition, demographic changes that fueled the greater inequity in TANF over time will have a similar impact on Medicaid over time. For example, states with larger elderly populations will be hit harder as those populations continue to age and, as a result, their health care costs rise.
TANF’s initial funding inequity mostly reflected differences among states in their AFDC cash benefit levels and the share of poor families receiving assistance. Many poor states had set very low cash assistance benefit levels under AFDC, so they received fewer federal TANF dollars per poor child than richer states. In 1997, the block grant amount per poor child ranged from $332 in Arkansas to more than $2,000 in Alaska, Connecticut, New York, Rhode Island, and Vermont. Thirty states’ block grant allocations fell below the nationwide average of $1,168.
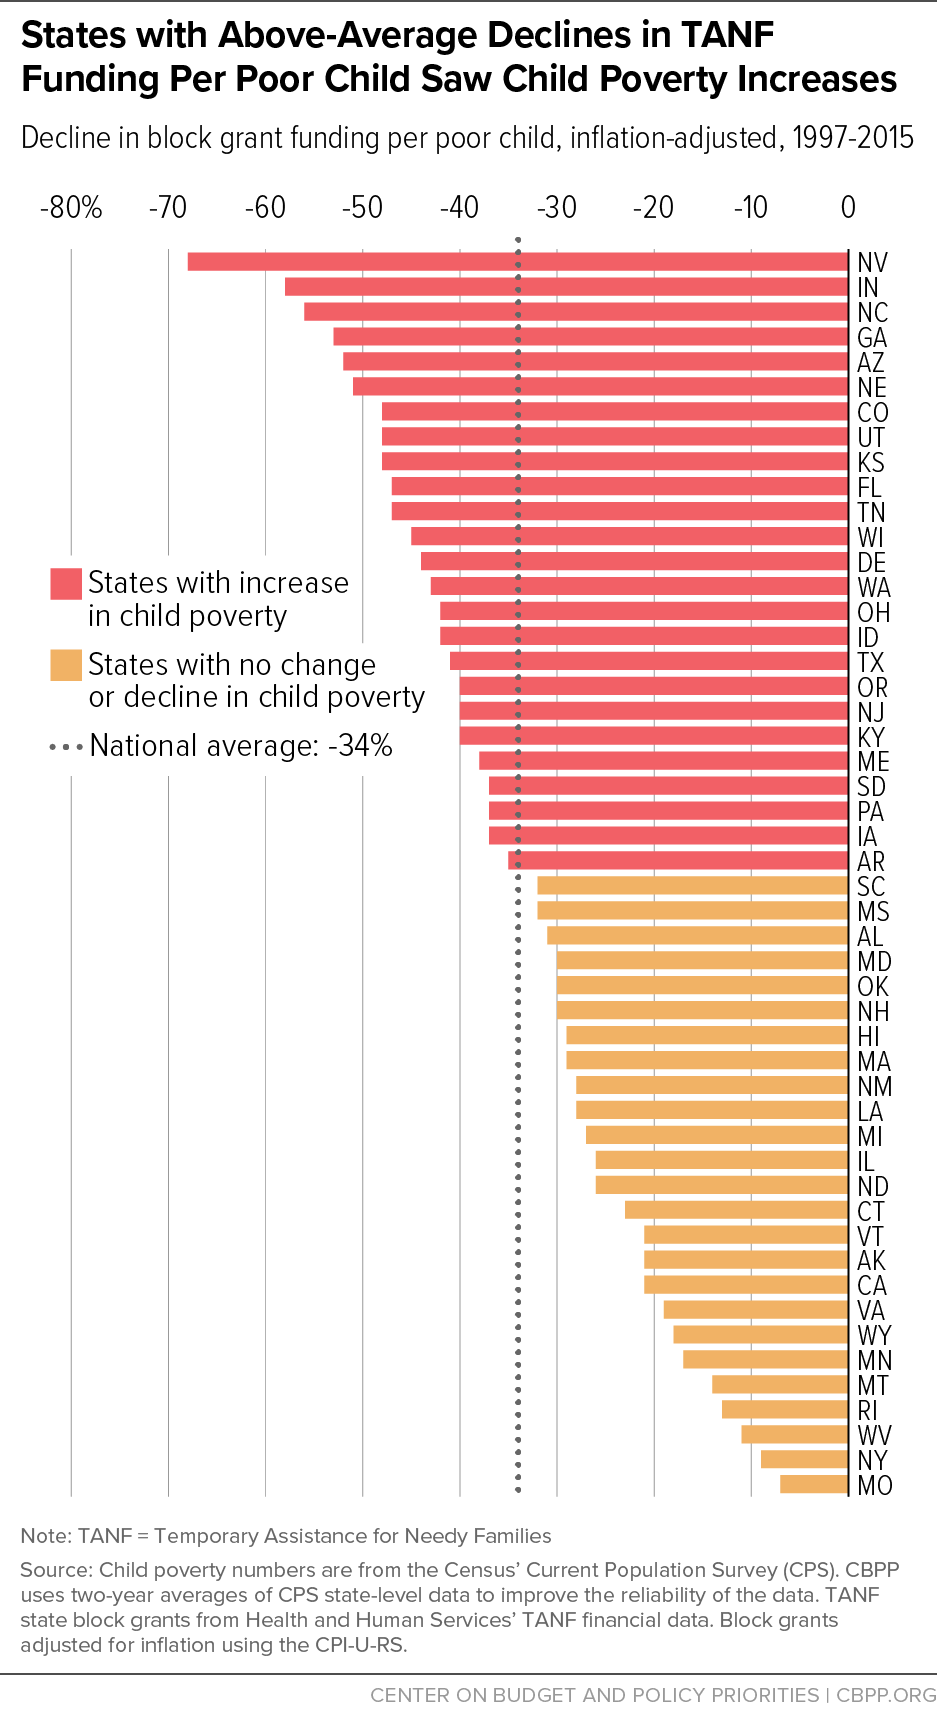
This basic formula hasn’t changed, with each state’s annual block grant funding remaining fixed (with no adjustment for inflation) since TANF’s inception. As a result, the block grant has lost 34 percent of its value nationwide on a per-poor-child basis. But, because the block grant also doesn’t adjust for changes in the number of poor children in particular states due to population growth or economic conditions, some states have fared substantially worse than others (see graph).
- Between 1997 and 2015, the number of poor children in Nevada more than doubled, so the state’s inflation-adjusted block grant per poor child fell in value by 68 percent, twice the nationwide decline.
- Over the same period, the number of poor children in Indiana rose by 60 percent, driving a 58 percent decline in value in the state’s inflation-adjusted block grant per poor child.
- New York, by contrast, had 25 percent fewer children in poverty in 2015 than in 1997, but its TANF block grant remained unchanged. As a result, the state’s inflation-adjusted block grant per poor child fell in value by just 9 percent.
Policymakers seeking to ensure that safety net programs remain valuable to poor families should learn the lesson from TANF and not look to block grants or similar approaches for other safety net programs. Fixed funding based on historic spending, as the House and Senate ACA repeal bills propose for Medicaid, is a bad deal for all states — but it’s especially bad for states that experience population growth or a change in the composition of their population. And poorer states have the most to lose under a block grant based on historical spending.