BEYOND THE NUMBERS
Families’ Worsening Rent Affordability Struggles, Illustrated
Rising rents and stagnant wages make it harder for families to keep a roof over their heads. Yet, funding for rental assistance has fallen sharply over the last six years, worsening a longer pattern of policymakers’ neglect that’s increased hardship for low-income families and hampered local communities’ efforts to reduce homelessness. Our new chart book illustrates these trends.
Beginning in 2011, policymakers enacted a series of budget cuts that hit non-defense discretionary programs — the category that includes most housing assistance for low-income families — particularly hard. The 2011 Budget Control Act (BCA) established tight annual budget caps through 2021 and mandated further cuts through a process known as sequestration.
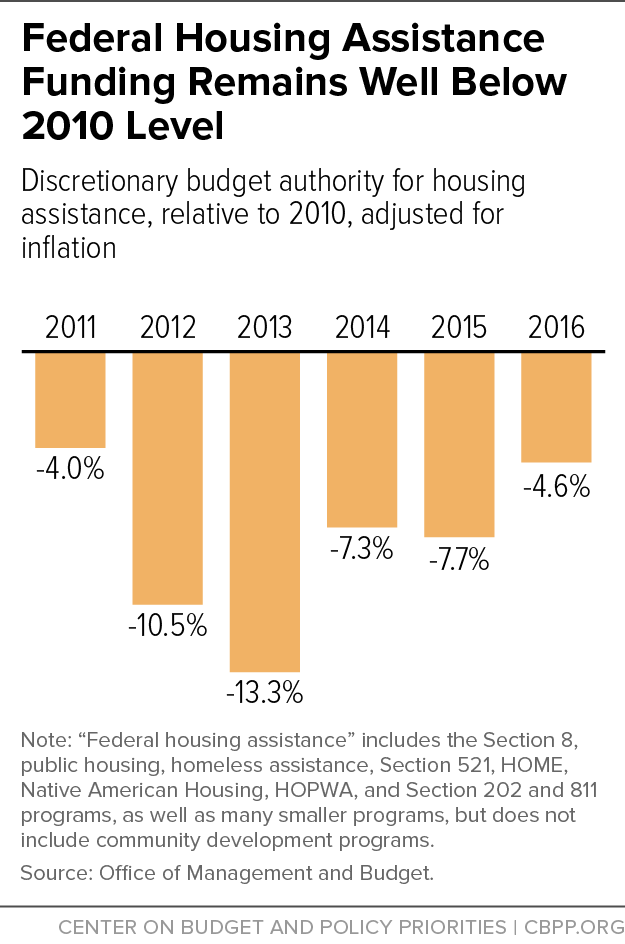
From 2010 to 2013, these steps caused annual housing assistance funding to fall by $6.2 billion, or 13.3 percent, in inflation-adjusted terms. Policymakers eased some of the sequestration cuts for 2014, 2015, and 2016, yet housing assistance funding in 2016 remains $2.1 billion, or 4.6 percent, below the 2010 level adjusted for inflation (see chart).
Among housing assistance programs, public housing and the HOME block grant have suffered the deepest funding cuts, falling by 21 percent and 52 percent, respectively, since 2010.
The number of families using Housing Choice Vouchers has also fallen sharply: some 45,000 fewer families were using vouchers in December 2015, compared to the end of 2012, due to the funding cuts.
The budget caps have worsened a longer pattern of neglect that began in the mid-1990s; I’ll be back tomorrow with more to say about that.