| NEWS RELEASE __________ |
|
|||||
| 820 First
Street, NE Suite 510 Washington, DC 20002 Tel: 202-408-1080 Fax: 202-408-1056 [email protected] www.cbpp.org
Robert Greenstein Iris J. Lav Board of Directors
David de Ferranti, Chair John R. Kramer, Vice Chair Henry J. Aaron Ken Apfel Barbara B. Blum Marian Wright Edelman James O. Gibson Beatrix Hamburg, M.D. Frank Mankiewicz Richard P. Nathan Marion Pines Sol Price Robert D. Reischauer Audrey Rowe Susan Sechler Juan Sepulveda, Jr. William Julius Wilson |
CENSUS DATA SHOW POVERTY
INCREASED, INCOME STAGNATED,
Census data released Thursday, August 26 show that the number and percentage of Americans living below the poverty line increased for the third consecutive year in 2003, and the number and percentage of people without health insurance also climbed for the third straight year, leaving 45 million Americans uninsured in 2003 — the largest number on record, with the data going back to 1987. Median household income stood at $43,318 in 2003, compared with $43,381 in 2002, not a statistically significant change. Since 2000 — the last year before unemployment began to rise — the number of people in poverty has risen by 4.3 million, median income has fallen by $1,535, after adjustment for inflation, and the number of people with no health insurance has increased by 5.2 million. The increase in poverty was concentrated among children. The poverty rate among children under 18 jumped from 16.7 percent to 17.6 percent between 2002 and 2003, and the number of poor children rose by 733,000, to 12.9 million. This rise accounted for a majority of the increase of 1.3 million in the overall number of poor people, which climbed from 34.6 million in 2002 to 35.9 million in 2003. More than one in every three poor people in 2003 were children. By contrast, the increase in the number of uninsured occurred entirely among working-age adults — those between the ages of 18 and 64. Both the number and the percentage of people aged 18 to 64 who were uninsured hit the highest levels on record. Some 36.3 million people — 20.2 percent of all people in this age group — were uninsured in 2003. While median income for households overall did not change, median income fell sharply for some groups, most notably households headed by young adults — those under age 34 — and Hispanics. For instance, median income fell $1,589 between 2002 and 2003 — or 3.4 percent — among households headed by someone aged 25 to 34. It fell $1,413, or 5 percent, among households headed by a 15-to-24 year-old person. Median income dropped $864, or 2.6 percent, among Hispanic households. In addition, those who were poor became poorer on average. The number of people living in extreme poverty — those with incomes below half of the poverty line — jumped by 1.2 million in 2003, to 15.3 million people. Some 43 percent of all poor people had incomes this low, as the percentage of poor people living in extreme poverty reached the highest level on record, with data available back to 1975. Another basic measure of the depth, or severity, of poverty — the average amount by which the incomes of those who are poor fall below the poverty line — also was greater in 2003 than in any other year since at least 1975.[1] Consistent with these findings, the share of national income going to the bottom fifth of households was the lowest on record, with data available since 1967. The rise in poverty and the lack of growth in median income primarily reflect weaknesses in the labor market in 2003. The average number of jobs fell by 410,000 from 2002 to 2003, and the average unemployment rate rose to 6.0 percent, up from 5.8 percent in 2002 and 4.0 percent in 2000. The percentage of Americans age 16 and older with jobs fell to 62.3 percent in an average month of 2003, the lowest percentage since 1993. Center on Budget and Policy
Priorities Director Greenstein “The year 2003 marked the third straight year that living standards have deteriorated,” Center executive director Robert Greenstein observed, “with poverty increasing, the number of uninsured climbing, and the income of the typical household stagnating. In addition, by some indicators, gaps between the most well-off and other Americans — already at exceptionally wide levels — became still larger in 2003.” Greenstein also said that “the federal government’s response to these adverse developments has been misdirected. As recent studies indicate, the nation has squandered huge amounts of resources on poorly designed tax cuts that greatly increased budget deficits and future widened gaps between the most well-off and everyone else, and did so without much pay-off in terms of jobs. These policies are burdening further generations with larger amounts of debt and starving the budget of resources that could be used to address such problems as the growing health insurance crisis.” Looking to 2004, he noted that “prospects for improvements in 2004 are uncertain. Health insurance coverage is likely to continue to erode, and it is unclear whether there will be substantial improvements on the poverty and income fronts. This uncertainty reflects ongoing softness in the labor market. While the unemployment rate is down somewhat from 2003, jobs are up modestly, and economic growth has been significant, the share of the population that is employed has failed to rise. In addition, average weekly wages have fallen this year, and the safety net for the unemployed has weakened with the untimely termination of the temporary federal unemployment benefits program. Three years into the recovery, early indications are that any improvements in 2004 are likely to be modest.” Health Insurance The number of people who lacked health insurance coverage throughout the year rose to 45 million in 2003, up 1.4 million from 2002 when 43.6 million were uninsured, and up 5.2 million from 2000 when 39.8 million were uninsured. In percentage terms, 15.6 percent of Americans — almost one in every six people — were uninsured in 2003. Although the economy has been slowly recovering since 2001, health insurance coverage has deteriorated, and more Americans have been unable to get needed medical care because they are uninsured. The principal reason for the further decline in health insurance coverage is the continued erosion of employer-based insurance coverage, spurred by continued escalation in the cost of health insurance, sluggish job growth, and the relatively high unemployment levels that persisted in 2003. The percentage of people with employment-based insurance dropped from 61.3 percent in 2002 to 60.4 percent in 2003. This is the lowest level of employment-based insurance coverage since 1993. In response to the loss of employer-based health insurance and the increase in the number of low-income people, combined enrollment in Medicaid and the State Children’s Health Insurance Program (SCHIP) increased to cover more people in 2003. These gains were particularly important for children, for whom the growth in Medicaid and SCHIP coverage was sufficient to offset the loss of private coverage. The percentage of children who lack health insurance was 11.4 percent in 2003, not a significant change from its 2002 level. For working-age adults (18 to 64 years old), the slight growth in Medicaid coverage was not sufficient to outweigh the much greater loss of employer-based health insurance coverage. (The majority of states set the Medicaid eligibility limit for parents well below the poverty line, and working-poor adults without children generally cannot get coverage through Medicaid unless they are seriously disabled.) The net effect is that the number of adults 18 to 64 who lacked health insurance coverage rose from 34.8 million (or 19.5 percent of such adults) in 2002 to 36.3 million (or 20.2 percent) in 2003, the highest levels ever recorded. “The availability of health insurance coverage for children under Medicaid and SCHIP was once again essential during a year when employer-based coverage continued to decline. As an entitlement program, Medicaid continues to respond to weak economic conditions, preventing even greater increases in the overall number of uninsured Americans,” said Greenstein. “The decline in employer-provided coverage and the limited nature of publicly funded health insurance for low-income working age adults means, however, that the number of adults without health insurance continues to climb.”
Mixed Prospects for Poverty and Income in 2004 So far in 2004, the economic news has been mixed. The unemployment rate averaged 5.6 percent for the first seven months of 2004, down somewhat from its 6 percent average for the same period of 2003, and the number of jobs has increased. Overall economic growth has been faster so far in 2004 than it was over the same period in 2003. At the same time, however, the percentage of adult Americans who are employed has not increased, and average weekly wages were lower, on average, in the first seven months of 2004 (after adjusting for inflation) than in the comparable period of 2003. Among full-time workers, wage losses from 2003 to 2004 have been greatest among low-paid workers. The safety net for unemployed workers also has weakened. At the end of 2003, Congress and the President permitted the Temporary Extended Federal Unemployment Compensation (TEUC) program — which provided additional weeks of benefits to workers whose regular unemployment benefits ran out before they could find jobs — to expire. (Congress had established the program in March 2002 to aid long-term unemployed workers and their families.) During the first seven months of 2004, some 2.2 million jobless workers exhausted all of their regular unemployment benefits without qualifying for further federal aid. This is the largest such number for any seven-month period on record, even after adjusting for growth in the labor force, with data available back to 1971. One normally would expect poverty to decline and income to rise at this stage of the economic cycle; after all, 2004 marks the third full year of recovery from an economic downturn. Yet early indications are that any improvements in 2004 are likely to be modest. Increases in Poverty The poverty rate (the percentage of Americans who are poor) rose in 2003 to 12.5 percent, up from 12.1 percent in 2002 (and 11.3 percent in 2000). Findings from the Census data released today include the following:
The Census Bureau defined poor families as those with cash incomes of less than $14,680 a year for a family of three ($18,810 for a family of four) in 2003. The average poor family has income of $8,858, or $738 per month. In 2002, the average poor family had income of $9,164 (in 2003 dollars). Increases in the Depth of Poverty As noted, the number of people with cash incomes below half of the poverty line increased by 1.2 million over 2002 levels, to 15.3 million. Some 43 percent of all people who were poor had income this low, the highest proportion on record, with data available back to 1975. The number of children living in extreme poverty rose by 515,000 in 2003, bringing the overall increase since 2000 in the number of children living below half the poverty line to nearly one million (929,000).
The average amount by which people who were poor fell below the poverty line also was greater in 2003 than in any year since at least 1975. The average amount by which people who were poor fell below the poverty line was $3,018 per poor person in 2003. Changes in Median Income Median household income stood at $43,318 in 2003. The change from the 2002 level (adjusted for inflation) of $43,381 was not statistically significant. While the overall decline in median income between 2002 and 2003 was not statistically significant, some groups did see significant drops in median income.
The median earnings of women working full time throughout the year (i.e., the earnings of the typical female full-time worker) also fell — by $171, or 0.6 percent, to $30,724. The median earnings of male full-time workers remained unchanged and stood at $40,668 in 2003. Income Disparities The Census Bureau released a variety of indicators of income inequality in its report. While some of these indicators — most notably the “Gini coefficient”[2] — did not show a widening of income inequality, other indicators did. Taken together, the income inequality measures suggest, if anything, that the gaps between the most well-off and other Americans — which already were at exceptionally wide levels — became still larger in 2003.
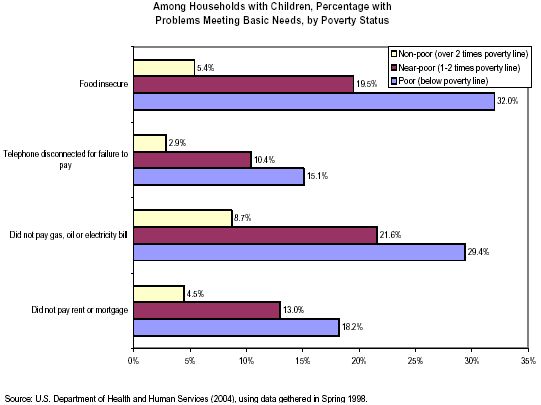
It bears noting that the Census information on income trends is incomplete and, in several respects, problematic. Limitations in the data prevent the Census Bureau from accurately capturing income changes at the very top of the income spectrum. The Census data miss a large share of the income of very-high-income households both because they do not include capital gains income and because (for confidentiality reasons) they fail to count earnings above $1 million. All households with earnings of more than $1 million are depicted in the Census data as having earned income of exactly $999,999. Because of these data limitations, the Census Bureau declines to publish data on the incomes of the top one percent of the population. Other data sources, most notably a Congressional Budget Office data series that corrects for these shortcomings in the Census data by supplementing the Census data with IRS data drawn from tax returns, are able to capture the income of the top one percent of the population much more accurately. (These CBO data include both capital gains income and the income of those who earn more than $1 million. The CBO data also include certain forms of income for lower-income households that the Census data miss, such as Earned Income Tax Credit payments.) The latest CBO data, which cover years from 1979 to 2001, show that the average after-tax income of the top one percent of the population rose by $408,800 — or 139 percent — over this 22-year period, after adjusting for inflation, while the average income of the middle fifth of households rose $6,300, or 17 percent. The average income of the bottom fifth rose just $1,100, or 8 percent, over the period. # # # # The Center on Budget and Policy Priorities is a nonprofit, nonpartisan research organization and policy institute that conducts research and analysis on a range of government policies and programs. It is supported primarily by foundation grants. APPENDIX Hardship Among the Poor A recent HHS study highlights some of the hardships that poor and near-poor families experience. The study, which contains data for 1998, shows that 32 percent of poor households with children experienced food insecurity at some point during the four-month period studied. In addition, over a twelve-month period, 15 percent of poor households with children had their phone disconnected for nonpayment of a phone bill, 29 percent did not pay a gas, oil, or electric bill, and 18 percent missed one or more rent or mortgage payments. (See figure below.)
A recent Center analysis, using the same data and methods as HHS employed, found that 51 percent of poor households with children experienced one or more of these or similar hardships. Other research confirms that poor families often endure substantial difficulties making ends meet. USDA data show that, in 2002, some 45 percent of poor households with children experienced either “food insecurity” or hunger at some point during the year. (This study found a higher rate of food insecurity than the HHS study noted above largely because this study measured food insecurity over a twelve-month period rather than a four-month period.) Households that experienced food insecurity were unable to acquire, or uncertain of having, enough food to meet the basic needs of all household members, because of insufficient income and resources. These findings lend credence to the Census Bureau’s poverty figures. They suggest that a majority of families with cash incomes below the poverty line have some difficulty making ends meet. Although experts agree that the current, official poverty measure has numerous shortcomings, such as failing to measure the effect of various non-cash benefits and taxes, these hardship figures indicate that the poverty measure nevertheless remains an indicator of hardship. End Notes: [1] The best way to measure the depth of poverty, or the "poverty gap," is to compare poor families’ incomes including non-cash benefits (such as food stamp and housing benefits) and the Earned Income Tax Credit (minus income and payroll taxes paid) to the poverty line. Unfortunately, the Census data released today do not allow this computation — these data provide information only on cash income and do not net out taxes. (The data that reflect non-cash benefits and taxes will not be available until late this year, according to the Census Bureau.) It appears likely, however, that the depth of poverty under this broader measure also will show an increase in 2003. Census data show that the poverty gap per poor person was larger in 2002 than in any year on record (with data going back to 1979) even when non-cash benefits and taxes are taken into account, and the data released today suggest that the poverty gap widened between 2002 and 2003. [2] The “Gini index of income inequality” — an important albeit technical measure of income inequality — equaled 0.464 in 2003; it equaled 0.462 in 2002. The higher the Gini is, the greater is inequality, but the difference between 2003 and 2002 was not statistically significant. [3] As discussed later in this section, the Census Bureau data do not permit an assessment of the income levels of the top one percent of the population or those at the 99th percentile. The incomes at this level — while still extraordinarily high by historic standards — are still very likely below what they were in 2000 (the peak of the stock market boom) and the ratio between households at the 99th percentile and other households also are very likely not the largest on record. |