
WHAT HAPPENED TO THE SURPLUS?
Detecting Misleading Figures and
Avoiding Being "Spun"
by Richard Kogan and Robert Greenstein
| PDF of full report If you cannot access the files through the links, right-click on the underlined text, click "Save Link As," download to your directory, and open the document in Adobe Acrobat Reader. |
In January 2001, the Congressional Budget Office projected a $5.6 trillion cumulative federal budget surplus over the ten-year period from 2002 to 2011.(1) On January 23, 2002, CBO will release a new projection showing a far less rosy picture. What happened? Some will cite the tax cut enacted last June as the largest single reason the surplus has shrunk, while others will cite the recession. Still others will cite "congressional spending increases."
Although CBO's new report will provide tables showing how and why the projected surplus changed from last January to this January, some readers may misunderstand CBO's figures. Most likely, others seeking to promote their own political agendas will misuse the figures. This analysis describes the possible pitfalls and distortions that policymakers, journalists, and the public should avoid — and should be wary of when others fall prey to or promote them — as they seek to understand what happened to the projected $5.6 trillion surplus. There are three main traps for the unwary (or opportunities for the unscrupulous):
- Confusing the short-run deterioration of the surplus with the long-run deterioration. In the next few years, the recession is the biggest reason the surplus disappeared. Later in the decade, after the economy has recovered — and over the ten-year period from 2002 to 2011 as a whole — the tax cut is the biggest reason for deteriorating surpluses.
- Confusing a ten-year total for 2002-2011 with a ten-year total for 2003-2012. Last year, CBO's projection covered the ten-year period from 2002 to 2011. The new projections CBO will issue on January 23 will cover the ten-year period from 2003 to 2012. To find out why the surplus shrank, one must be sure to analyze changes in the surplus for the same period of time.
- Failing to attribute increases in interest payments on the debt to the actions or changes in conditions that caused those payments to increase. A tax cut reduces federal revenues and thus reduces projected budget surpluses. Similarly, increases in funding for federal programs boost federal expenditures and thereby reduce the surpluses. The decreases in revenues and increases in expenditures that occur as a result of a recession also shrink the surplus. In each of these cases, the reduction in the surplus results in an increase in the federal debt, compared with the level of debt that CBO had assumed in its previous budget projections. This increase in the debt automatically causes federal interest payments to rise, since interest must be paid on a higher level of debt. Moreover, the increase in the amount the federal government must pay in interest itself causes the surplus to shrink further. The new CBO estimates are likely to show that interest payments on the debt will cost the government roughly $1 trillion more between 2002 and 2011 than CBO projected just one year ago.
These increases in interest payments are a major factor in the deterioration of the surplus. To measure accurately the budgetary consequences of a tax cut, a spending increase, or any other change in the budget, one must include the resulting increase in interest payments caused by the tax cut, spending increase, or change in economic or other conditions.
The third trap that can lead to misuse of the CBO numbers occurs when someone includes the resulting increase in interest payments when measuring the effect on the surplus of some budget changes — such as the reduction in revenues and increase in expenditures that has occurred because of the recession — but then excludes the resulting interest increases when measuring the effects of other budgetary changes such as the tax cut. Such inconsistent treatment of interest payments leads to apples-to-oranges comparisons when assessing the relative impact of various factors on the change in the surplus.
In this analysis, we use the budget estimates contained in a table issued by the Senate Budget Committee Republican staff earlier this month to illustrate these three traps. The Budget Committee table shows that the ten-year surplus from 2002 through 2011 has shrunk by $3.8 trillion since CBO's estimate of last January — from $5.6 trillion in last January's estimate to less than $1.9 trillion today. The data in this table also show that the tax cut enacted last June is the largest single cause of this deterioration, accounting for 44 percent of the $3.8 trillion shrinkage over this period. Downward reestimates (mostly of revenues) caused by a weaker economy and other factors account for 39 percent of the ten-year shrinkage in the surplus. Program increases enacted last year — much of which are in the defense and homeland security areas — account for the remaining 17 percent.
These specific figures will change somewhat when the new CBO projections are released on January 23. The figures in the forthcoming CBO report are expected to be similar, but not identical, to those in the Budget Committee table.(2)
1. Confusing the Short Run and the Long Run
The factors causing the surplus to disappear in the short run are different from those that cause its steep reduction over the long term. The confusion between the short run and the long run is discussed at greater length in a recent Center report.(3) In the short run — fiscal years 2002 and 2003, for instance — the recession is the primary culprit. Over the next few years, the shrinking economy generates significant revenue shortfalls as well as automatic increases in the costs of programs such as unemployment compensation, which are designed to expand or shrink as need fluctuates. In contrast, by the end of the decade, the cost of the tax cut grows to the point that it accounts for the majority of the shrinkage of the surplus in those years.
Over the 2002-2011 period as a whole, the impact of the tax cut exceeds the impact of downward reestimates of the surplus caused by the recession and other factors, and far exceeds the impact of program increases enacted last year.
|
||||||||||||||||||||||||||||
2. Which Ten-Year Period?
The Senate Budget Committee Republican estimates — as well as similar estimates issued this month by both the House Budget Committee and Senate Budget Committee Democratic staffs — show a projected surplus of $1.8 trillion or $1.9 trillion over the 2002-2011 period. This constitutes a decline of approximately $3.8 trillion from the CBO projection issued a year ago. When CBO issues its new forecast on January 23, the forecast is likely (assuming the Senate Budget Committee Republican estimates are similar to those CBO will unveil) to show a ten-year surplus of approximately $2.4 trillion. Readers of the CBO report should not be misled, however: while it may look as though the ten-year surplus has shrunk by $3.2 trillion — from $5.6 trillion last January to $2.4 trillion this January — such a conclusion would not be valid; it would compare surplus projections for two different time periods. The previous estimate of $5.6 trillion covered the ten-year period 2002-2011, while the new figure of approximately $2.4 trillion will cover the ten-year period 2003-2012.
|
||||||||||||
To ascertain why the projected surplus has shrunk, one must focus on what happened over a single, given time period, such as 2002-2011. Over the ten-year period from 2002 to 2011, the surplus declined (according to the Senate Budget Committee Republican figures) by $3.8 trillion, not $3.2 trillion. To understand why the projected surplus shrank, we need to explain the $3.8 trillion deterioration. (It also may be noted that the forthcoming CBO estimates for 2012 will be anomalous, since these estimates will assume that the entire tax cut has expired and none of it will be in effect in 2012.)
3. Increased Interest Payments on the Debt
Although this issue may sound arcane, it is critical in analyzing changes in the budget. If this issue is handled incorrectly, as is too often the case, the resulting analysis will be invalid and, most likely, will produce misleading results.
Last January, CBO's budget projection showed that federal interest payments would total $0.6 trillion over the ten-year period from 2002 to 2011. This January's projection may show a figure of approximately $1.6 trillion, a $1 trillion increase. What caused projected interest payments to climb by $1 trillion? The answer is as follows.
- Three primary factors — the tax cut, legislation that increased the size of federal programs, and revenue shortfalls caused by the recession (along with other downward reestimates of revenues and upward reestimates of the cost of entitlement programs) — caused the surplus to shrink by a total of $2.7 trillion over the 2002-2011 period.
- That $2.7 trillion reduction in the projected surplus by itself means the Treasury will redeem $2.7 trillion less federal debt than CBO had projected last January.
- Since the Treasury will hold $2.7 trillion more in federal debt than previously expected, it will have to pay considerably more in interest payments on that debt. Moreover, the higher interest payments themselves will shrink the surplus further and thereby produce additional debt and hence still higher interest payments. The result ends up being an increase of more than $1 trillion in interest payments over the period 2002-2011, and thus a net federal debt in 2011 that is $3.8 trillion higher (rather than $2.7 trillion higher) than projected last January.(4) (The $3.8 trillion figure matches the amount by which the projected ten-year surplus will have deteriorated over this period, as shown in Table 2.)
Why is this apparently technical discussion of debt and interest so important? Because the higher interest payments are an automatic consequence of the three primary factors: the tax cut, spending legislation, and revenue shortfalls and other economic and technical budget reestimates caused by the recession and other developments. In evaluating the relative contributions of tax cuts, spending increases, and budget reestimates to the deterioration of the surplus, there are two legitimate ways to treat these large increases in interest payments. There also are a number of misleading approaches that can be used, which distort the data and can mislead policymakers, journalists, and the public.
Legitimate Ways to Handle Interest Costs
The best approach to handling increases in interest payments when ascertaining the causes of the decrease in the surplus is to attribute the appropriate portions of the increase in interest payments to each of the three factors that caused the surplus to deteriorate. For example, the tax cut by itself costs $1.3 trillion over the ten-year period 2002-2011. The tax cut also will cause interest payments to grow by almost $0.4 trillion over the same period. Thus, the total cost of the tax cut — i.e., the total amount by which the tax cut reduced projected surpluses — is $1.7 trillion. Likewise, the total cost of the budget reestimates — including the increase in interest costs that results from the new estimates — is $1.5 trillion; this consists of $1.0 trillion due to the reestimates themselves and almost $0.5 trillion due to the resulting increase in interest payments. The total cost of the program increases enacted last year — including the cost of interest payments — is $0.6 trillion. The majority of these program increases consists of increases in defense and anti-terrorism spending.
|
||||||||||||||||||||||||||||
Another legitimate (although less illuminating) approach is to compare the size of the tax cuts, the spending increases, and the budget reestimates, without attributing debt service to any of these three factors. Under this approach, the ten-year cost of the tax cut is $1.3 trillion, the budget reestimates are $1.0 trillion, and the program increases are $0.5 trillion. Whether one attributes the increase in interest payments to the causes of these increased payments or sets the increase in interest payments to the side, the tax cut is the largest single cause of the deterioration of the surplus over the ten-year period. (See Table 4.)
While both of these approaches to handling interest payments are legitimate, the first approach is distinctly preferable. Otherwise, increases in interest payments on the debt may appear to be an independent factor, rather than a derivative of the actions that policymakers have taken to reduce taxes or increase spending or of economic and other changes.
|
||||||||||||||||||||||||||||||||||||||||
It may be noted that critics of government spending usually include the increases in interest payments engendered by Congressional action that boosts spending when they discuss the magnitude of the spending increases. Last spring, for example, the Bush Administration and its supporters devoted considerable attention to what they said was a $600 billion deterioration in the ten-year surplus (for 2001-2010) caused by legislation enacted in the summer and fall of 2000, before the Administration assumed office. The $600 billion estimate included the higher interest payments caused by the spending legislation. It was appropriate for the Administration and its supporters to cite the $600 billion figure as the ten-year cost of the actions taken by the previous Congress. (This figure included increases in both defense and domestic funding.) It is equally appropriate to include higher interest payments when calculating the cost of legislation enacted by the current Congress, including both the tax cut and increases for defense and other spending.
Illegitimate Ways to Handle Interest Costs
When examining the causes of the deterioration of the surplus, what is not legitimate is to include the resulting increase in interest payments in calculating the cost of some actions or conditions that have caused the surplus to shrink, while omitting the resulting increase in interest payments when calculating the cost of other actions or conditions that reduced the surplus. Unfortunately, the configuration of some CBO tables (and of tables likely to be produced by some in Congress) may inadvertently lead some observers to commit this error. Often, the increase in interest payments resulting from the enactment of legislation is shown on a separate line of the budget table from the cost of the legislation itself, while the increase in interest payments resulting from budget reestimates due to economic or technical factors is simply included in the line showing the cost of those reestimates. If an unwitting observer compares the cost of legislation without the associated interest costs to the cost of reestimates with the related interest costs, the observer will be comparing apples to oranges.
For instance, one recent news article stated that the Senate Budget Committee Republican staff estimates showed the tax cut reduced the surplus by $1.3 trillion over ten years while budget reestimates due to economic and technical factors reduced the surplus by a larger amount, nearly $1.5 trillion.(5) This article erred — it unwittingly compared the cost of the tax cut excluding the resulting interest costs to the cost of the budget reestimates including the resulting interest costs.
A still more serious error can occur if increases in interest payments caused by a Congressional action are not only omitted when the budgetary impact of that action is measured, but are attributed incorrectly to another, entirely unrelated Congressional action. This mistake has been made a number of times in the past. Whether purposefully or not, some have not only omitted the increases in interest payments resulting from past tax cuts when presenting the budgetary impact of those tax cuts, but have mistakenly counted these same interest payments as an increase in government spending caused by Congressional actions to raise spending.
|
||||||||||||||||||||||||||||||||||||||||||||||||||||||
Counting increases in interest payments caused by tax cuts as though they represented actions by Congress to increase spending is not only inaccurate, but deceptive and highly misleading. Table 5 compares these two improper approaches with the analytically sound approach, as described above.
Let us once again consider the changes in the surplus over the past year reflected in the Senate Budget Committee Republican staff estimates. Misleading approach #1 (the approach that counts increases in interest costs as part of the costs of budget reestimates but not as part of the cost of tax cuts or program increases) leads to the erroneous conclusion that the budget reestimates have been more significant than the tax cut in causing the deterioration of the ten-year surplus, a conclusion not borne out by proper analysis. (It may be noted that even under this misleading approach, the impact of the tax cuts on the ten-year surplus is at least 2½ times greater than the impact of congressional spending increases.(6)) Misleading approach #2 (under which the increase in interest costs resulting from the tax cuts is inappropriately counted as a spending increase) manages simultaneously to understate the role of the tax cuts and overstate the role of program increases. The figures produced under this approach would lead people to believe mistakenly that Congress had enacted spending increases that, over ten years, were nearly as large as the tax cut. This would constitute an especially egregious distortion of the data.
Reestimates: Not Just the Economy Some news reports describing the recent Senate and House Budget Committee staff estimates reflect another misconception — that all of the budget reestimates that CBO is making for economic and technical reasons reflect the impact of the weaker economy. In fact, CBO is likely to characterize a significant portion of these reestimates — including a sizeable portion of the downward reestimates of revenues — as being "technical" rather than economic in nature, especially in the latter part of the decade. The technical revenue reestimates reflect a reduction in revenues beyond what can be attributed to a weaker economy. Preliminary indications are that revenues have shrunk by more than macroeconomic models would indicate. It appears that, for any given level of GDP, a smaller share is now showing up as taxable revenue. This is the opposite of the trend from the mid-1990s to January 2001, when the economy grew but revenues grew faster. If CBO concludes that the ratio of tax revenues to GDP is now declining for reasons unrelated to the tax cut or the recession, CBO may project that such downward "technical" reestimates will last throughout the decade. The impact of these downward revenue estimates for technical reasons could be likely to be substantial. |
4. The Shrinkage of the Surplus and the New Budget Reality
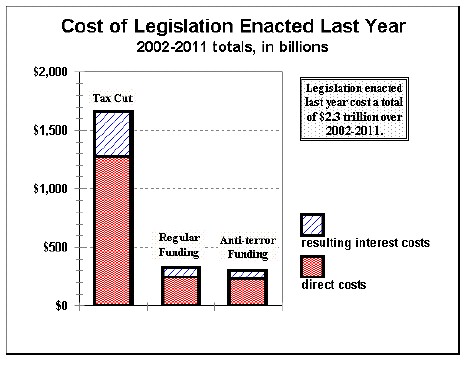
One way to think of the large budget reestimates that CBO will make for economic and technical reasons is to think of these reestimates as constituting a new budget reality. Last year, it appeared there were massive surpluses. With the benefit of hindsight, we now see there was less money on the table for tax cuts and program expansions than we thought, even in the absence of tax cuts or program increases. Given this new reality, a reasonable question is, "What happened to the surpluses that, based on what we now know about economic and technical factors, actually existed as of a year ago?" This question can be answered by focusing solely on the impact on the surplus of the legislation enacted over the last year.
As the graph on the next page shows, over the past year the Congress and the President agreed to legislation that reduced the surplus by a total of $2.3 trillion over the ten-year period from 2002 to 2011. The tax cut accounted for 72 percent of these costs.
Conclusion
Honest analysis requires using comparable figures. One should not confuse the short run with the long run or compare one ten-year period with a different ten-year period. One also should not selectively attribute higher interest payments to the cause of those payments in some cases but not in others. Nor should one count higher interest payments caused by either tax cuts or downward revenue reestimates as "spending increases" caused by Congressional action to expand government programs.
End notes
1. The $5.6 trillion figure, like all figures in this paper, covers all federal programs, including the Social Security Trust Fund, which CBO projected would run a $2.5 trillion surplus from 2002 through 2011. Without Social Security, last January's projected surplus was much smaller and this January's projection is expected to show a deficit in most years.
2. The Democratic staffs of the House and Senate Budget Committees also have prepared new ten-year estimates, which are similar to the Republican estimates. The projections by the two Democratic staffs differ slightly from each other, and each is slightly more pessimistic than the Republican projections in the short run but slightly more optimistic in the second half of the decade. All three sets of projections come to virtually identical ten-year totals.
3. See "Debate Over Causes of Deterioration of Surplus Marred by Failure to Distinguish Between Short-Term and Long-Term Impacts," Joel Friedman and Robert Greenstein, Center on Budget and Policy Priorities, January 16, 2002, available at https://www.cbpp.org/1-16-02bud.htm.
4. Interest payments over ten years would increase by $1 trillion because of a higher level of projected debt, as explained above. They may also grow or shrink because of changes in the projected level of interest rates, an "economic reestimate."
5. "Democrats, Republicans estimate 2002-2011 Budget Resources Differently," Daily Tax Report, January 10, 2002.
6. Certain provisions of the tax cut expanded refundable tax credits. By longstanding convention, tax refunds paid when a tax filer has no remaining income tax liability are classified for accounting purposes as outlays. The tax bill included $0.1 trillion in ten-year costs stemming from refundable tax credits (including the associated increase in interest payments); this analysis counts these costs as part of the costs of the tax cut legislation, since it was the tax cut that expanded these tax credits. CBO, while also attributing these costs to the tax bill, may segment its analysis of the tax bill between "outlay changes" and "revenue changes," in which case the refundable credits stemming from the tax bill will be included as "outlays changes." To see the total budgetary effects of last June's tax cut legislation, one must include both the revenue losses and the outlay increases caused by the expansion of these tax credits. (Note: Even if one characterizes the refundable portion of the expanded tax credits as spending increases rather than tax cuts, the revenue losses from the tax cut, along with the interest payments generated by those revenue losses, remains the single largest factor in the deterioration of the ten-year surplus.)