What New CBO Data Indicate About Long-Term Income Distribution Trends
The Congressional Budget Office releases the most comprehensive data available on changes in incomes and taxes for different income groups. The data that CBO issues have two main advantages compared with the more widely-cited Census data. The CBO data capture trends at the very top of the income scale; Census data explicitly do not. (For example, the standard Census data do not include wage and salary incomes above $1 million or capital gains income.) The CBO data also measure after-tax income, a better measure of how much income households have at their disposal than the before-tax income measure used by Census.
CBO has just released its income and tax information for 2002. [1] This information underscores the degree to which income gains have been concentrated at the top of the income scale over the past two-plus decades. Between 1979 (the first year the CBO data cover) and 2002:
- The average after-tax income of the top one percent of the population more than doubled, rising from $298,900 to $631,700, for a total increase of $332,800, or 111 percent. (CBO adjusted these figures for inflation and expressed them in 2002 dollars.)
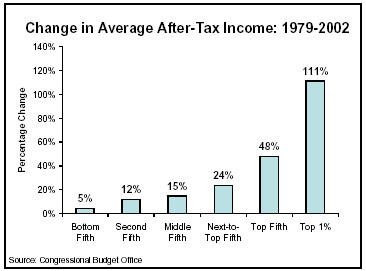
- By contrast, the average after-tax income of the middle fifth of the population rose a relatively modest 15 percent, or $5,700, reaching $43,700 in 2002.
- The average after-tax income of the poorest fifth of the population rose just 5 percent, or $600, over the period.
Because incomes grew fastest among the most affluent, this group’s share of the total national income grew as well.
- The top one percent of the population received 11.4 percent of national after-tax income in 2002, up from its already-large 7.5 percent share in 1979. (Each percentage point of after-tax income is equivalent to $62 billion in 2002 dollars.)
- In contrast, the shares of national income received by various groups of low- and middle-income people all fell. The middle fifth of the population received 16.5 percent of the national after-tax income in 1979, but 15.8 percent in 2002. The bottom fifth received 6.8 percent of such income in 1979, but 5.1 percent in 2002.
Income is now more concentrated at the very top of the income spectrum than in all but six years since the mid-1930s. This conclusion is reached by viewing the CBO data in conjunction with data from a ground-breaking historical analysis of income distribution trends published in a leading economics journal in 2003.[2] Viewed together, the studies indicate that the richest one percent of households now receive a larger share of the national income than at any time since 1937, except for 1988 and the period from 1997 to 2001.[3]
Income concentration peaked in 2000, the year the stock market peaked. From 2000 to 2002, income became less concentrated at the very top, at least in part due to the drop in the stock market. The after-tax incomes of most groups fell from 2000 to 2002, but fell significantly more sharply for the top one percent. Even so, after-tax remained exceptionally concentrated among the top one percent in 2002.
Since 2002 income gains at the top may have outpaced the gains across the rest of the income spectrum. For instance, the ratio of the pay of the nation’s chief executive officers to the pay of average workers fell sharply from 2000 to 2002, but rose from 2002 to 2003. [4] Further, in August 2004 the Census Bureau released a variety of indicators of income inequality going through 2003. These income inequality measures suggest, if anything, that the gap between the most well-off and other Americans became larger in 2003 than it was in 2002 (the qualification “if anything” is necessary because the changes in 2003 in certain income measures were not statistically significant). The Census measures also show a long-term trend toward greater income concentration.
| Average After-Tax Income by Income Group | ||||
| Income Category | 1979 | 2002 | Percent Change | Dollar Change |
| Lowest fifth | $13,200 | $13,800 | 4.5% | $600 |
| Second fifth | $26,700 | 29,900 | 12.0% | $3,200 |
| Middle fifth | $38,000 | $43,700 | 15.0% | $5,700 |
| Fourth fifth | $49,800 | $61,700 | 23.9% | $11,900 |
| Top fifth | $87,700 | $130,000 | 48.2% | $42,300 |
| Top 1 Percent | $298,900 | $631,700 | 111.3% | $332,800 |
| Source: Congressional Budget Office, Effective Federal Tax Rates: 1979-2002, March 2005. | ||||
End Notes
[1] Congressional Budget Office, Historical Effective Federal Tax Rates: 1979 to 2002, March 2005.
[2] Thomas Pickety and Emmanuel Saez, “Income Inequality in the United States, 1913-1998,” Quarterly Journal of Economics, 118, 2003. Their tables have been updated through 2002 at http://emlab.berkeley.edu/users/saez/
[3] Data for 1986 are ignored in this comparison. Incomes at the top were distorted that year because high-income taxpayers made temporary adjustments to their incomes in response to the passage of a tax reform bill.
[4] Lawrence Mishel, Jared Bernstein, and Sylvia Allegretto, The State of Working America 2004-05, September 5, 2004, page 214.