|
September 12, 2008
HOW PROJECTED SURPLUSES BECAME DEFICITS:
Main Causes Were Tax Cuts and Higher Security Spending
By Richard Kogan and Gillian Brunet
The federal budget is projected to run a $546 billion deficit in 2009, compared with the $710 billion surplus that budget experts projected for 2009 back when President Bush took office nearly eight years ago. This $1.3 trillion deterioration in the nation’s fiscal finances for 2009 can be seen by comparing estimates that the Congressional Budget Office (CBO) released this week with those that CBO released in January 2001.
The story is much the same for the entire ten-year period covered by CBO’s 2001 projection. In January 2001, CBO projected a cumulative $5.6 trillion surplus for 2002-2011. Now, CBO’s new report suggests the nation will amass a cumulative deficit of $3.8 trillion over that same period, marking a $9.4 trillion deterioration.
For both 2009 and the ten-year period, this massive deterioration is partly due to weaker-than-expected performance of the economy, along with other “technical” factors that are beyond policymakers’ control. But these economic and technical factors account for less than one-fourth of the fiscal deterioration for each period, and they are not responsible for the return of deficits. Even given the disappointing performance of the economy since 2001 relative to CBO’s earlier projections, there would have been large surpluses in every year — totaling $3.4 trillion over the 2002-2011 period — if policymakers had enacted no tax cuts or program increases since 2001.
The dominant factor in the unprecedented fiscal deterioration thus was not the performance of the economy. Nor was it increases in domestic programs. The key factors have been large tax cuts and increases in security-related programs. For fiscal 2009, some $1 trillion of the $1.3 trillion deterioration in the nation’s fiscal finances stems from policy actions, and tax cuts account for 42 percent of this $1 trillion deterioration. Increases in military and other security programs account for another 40 percent of the deterioration.
The story is much the same for the ten-year period as a whole. For the 2002-2011 period, tax cuts and increases in security programs account for more than four-fifths of the fiscal deterioration caused by policy actions. Increases in domestic programs played a much more modest role.
|
The Trillion-Dollar Deterioration in the Budget
(Based on CBO’s January 2001 and September 2008 Budget Projections) |
|
|
2009 |
Cumulative, 2002-2011 |
| Jan. 2001 projection |
$ 710 billion surplus |
$5.6 trillion surplus |
| Sept. 2008 estimate |
$ 546 billion deficit |
$3.8 trillion deficit |
|
Total deterioration |
$1,256 billion ($1.3 trillion) |
$9.4 trillion |
|
Deterioration solely from tax cuts and budget increases |
$1.0 trillion |
$7.2 trillion |
The rest of this analysis examines in more detail the factors behind the $1 trillion budgetary deterioration in 2009, and the $7.2 trillion deterioration over the 2001-2011 period, that were caused by policymakers’ actions rather than economic or technical factors.
Impact of Tax Cuts and Spending Increases on the Budget for Fiscal Year 2009
As noted, tax cuts and program increases enacted by Congress have worsened the budget by about $1 trillion in 2009. (These figures assume that tax and program policies in place today will be continued.[1]) As shown in Figure 1, the key components are:
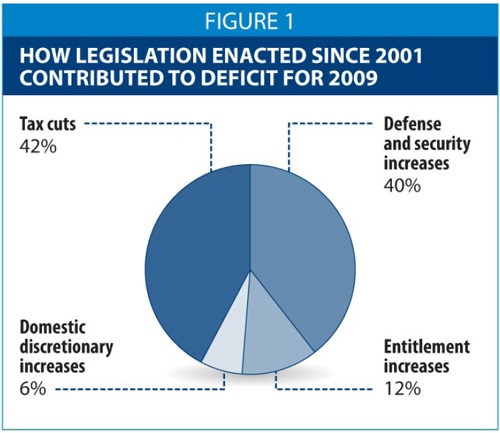
-
Tax cuts. Enactment of the 2001 and 2003 tax cuts, along with AMT relief, the normal “tax extenders,”[2] and a variety of minor tax provisions have worsened the 2009 budget by $427 billion and thus account for 42 percent of the $1 trillion deterioration. These figures include both the direct[3] costs of the tax cuts and their associated interest costs. (By reducing projected revenues, the tax cuts have increased deficits and debt relative to the January 2001 projection. With higher debt, the Treasury must pay more interest.)
-
Increases in appropriations for defense, international affairs, and homeland security. Expenditures projected for this portion of the budget in 2009 are much higher than CBO projected in early 2001. While a substantial portion of the extra costs stem from the wars in Iraq and Afghanistan, there have also been significant increases in the underlying budgets of the Departments of Defense, State, and Homeland Security that are not directly related to these wars. Total increases in this part of the budget amount to $399 billion in 2009, relative to CBO’s projection, and thus account for 40 percent of the $1 trillion deterioration, when the associated interest costs are included.
-
Increases in entitlement programs. Since 2001, Congress has enacted a number of entitlement increases, most notably the Medicare prescription drug benefit, but also increases in farm and nutrition programs, military retirement and health care, veterans’ education benefits, and other, smaller programs. These cost increases amount to $119 billion in 2009, or 12 percent of the $1 trillion deterioration.
-
Increases in appropriations for domestic, or non-security, programs. Funding for this portion of the budget has also increased above the levels projected in 2001, although this funding peaked in real terms in 2004 and has generally declined since then. The largest increases have occurred in education programs, veterans’ health care, and transportation programs. The increased expenditures in this part of the budget total $66 billion in 2009, or 6 percent of the $1 trillion deterioration.
As can be seen, tax cuts and defense/security increases account for 82 percent of the budget deterioration in 2009 that is attributable to legislation enacted since January 2001. Increases in domestic spending account for 18 percent.
Impact of Tax Cuts and Budget Increases Over the 2002-2011 Period
Tax cuts and program increases enacted by Congress have worsened the budget by almost $7.2 trillion over the entire 2002-2011 period, an average of almost $720 billion per year. (As noted above, these figures assume that tax and program policies in place today will be continued; see footnote 1.) As Figure 2 shows, the key components are:

-
Tax cuts. The 2001 and 2003 tax cuts and other tax provisions listed earlier will increase deficits by more than $3.3 trillion over the ten-year period, accounting for 46 percent of the $7.2 trillion deterioration. These figures include both the direct costs of the tax cuts and their associated interest costs.
-
Increases in defense, international affairs, and homeland security. These increases total almost $2.7 trillion over the ten-year period, or 37 percent of the $7.2 trillion deterioration, when the associated interest costs are included.
-
Increases in entitlement programs. These increases, plus the associated interest costs, total $745 billion over the ten-year period, or 10 percent of the $7.2 trillion deterioration.
-
Increases in domestic (or non-security) discretionary programs. These increases, plus the associated interest costs, total $456 billion over the ten-year period, or 6 percent of the $7.2 trillion deterioration.
Tax cuts and defense/security increases account for 83 percent of the budget deterioration over the 2002-2011 period that is attributable to legislation enacted since January 2001. Domestic spending increases account for 17 percent.
In sum, tax cuts, increased defense and security funding, and a dose of economic cold water are, in order, the three key reasons that the large surpluses projected in January 2001 turned into substantial deficits. Increases in domestic programs have been relatively modest in comparison.
End Notes:
[1] The results for 2002-2007 are already known, and CBO estimates a deficit of $407 billion for 2008. For 2009 — and 2010-2011 as well — we derive our figures from CBO’s newest “baseline” projection, but we modify it in five ways. We assume that Congress will: (1) extend all expiring tax cuts, such as the 2001/2003 tax cuts and the normal “extenders” (but not the temporary tax rebates enacted in February 2008); (2) continue AMT relief, in essence by indexing the parameters of that tax; (3) fund the ongoing costs of the Defense Department at the 2009-2011 levels specified in the President’s budget of February 2008; (4) fund the wars in Iraq and Afghanistan at levels consistent with one of the two scenarios for war costs presented by CBO, which showed a gradual phasedown to 75,000 troops in those countries; and (5) continue to provide relief from scheduled reductions in the Medicare reimbursement rate for physicians’ services.
[2] These are a series of temporary tax cuts that Congress extends on a routine basis, such as the research and experimentation tax credit.
[3] In accounting for the direct costs of tax cuts, we include the full cost of provisions that create or increase the size of “refundable” tax credits. Technically, the portions of such tax credits that exceed what would otherwise be a taxpayer’s income-tax liability are recorded as outlays rather than revenue losses. The amounts in question are small; counting the increases in the refundable components of tax credits as outlays would have moved an amount equal to about 2 percent of the 2009 deterioration caused by policy action from the tax side to the expenditure side of our display. |