|
July 31, 2007
STATE EXPENDITURE GROWTH SLOWING
By Elizabeth C. McNichol, Nicholas Johnson and Sarah Farkas
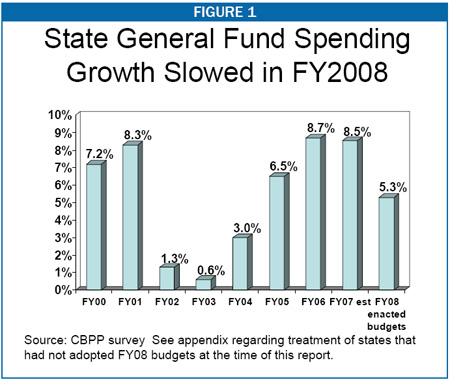
State expenditure growth is projected to slow significantly for fiscal year 2008, which is the 12-month period that began July 1, 2007 in most states. During May, June, and early July, the Center on Budget and Policy Priorities conducted a phone and email survey of state legislative and executive budget officials to learn states’ actual General Fund spending for fiscal year 2006, their best estimate of fiscal year 2007 spending, and the fiscal year 2008 spending included in their recently enacted budget. The preliminary results of this survey show that in fiscal year 2008, General Fund spending will grow about 5.3 percent — well below the rates of growth in fiscal years 2006 and 2007. (See Figure 1.)
This slowdown in spending growth signifies a change in states’ fiscal conditions. On average, state budgets’ growth rate has declined to a level roughly one percentage point below the average growth over the last few decades. The 2008 level of 5.3 percent is likely to be a minimal amount needed to maintain current spending commitments. Such expenditure growth in the range of 5 to 6 percent is necessary for state budgets just to maintain the status quo in the face of growing costs for health care, education and other services as well as changes in the number of school-age children, the elderly and other populations to which state services are of particular importance. This rate typically leaves little room for major new initiatives.
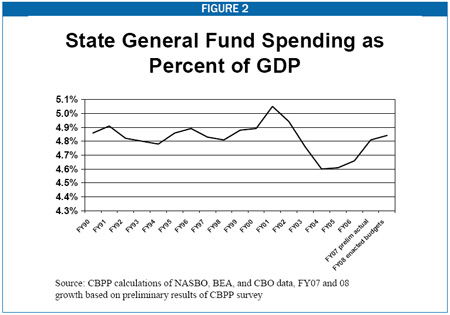
The 2008 budget also marks an end to a period of dramatic fluctuations in the rate of growth of state spending. This period began in fiscal year 2002, as the recession caused state revenues to decline, which in turn led states to balance their budgets through spending cuts. For the ensuing three years — fiscal year 2002, fiscal year 2003, and fiscal year 2004 — overall expenditure growth was very low, well below what was needed to maintain services. By fiscal year 2006 states had emerged from the recession and revenues were growing again. State expenditures grew above average rates in fiscal year 2006 and fiscal year 2007. This rapid growth in spending was necessary for state expenditures to “catch up” after the 2001 recession. States were working their way out of a deep hole: just two years ago, at the end of fiscal year 2005, state spending was at its lowest level as a share of the economy in 15 years. Since then, state spending has risen from 4.6 percent of GDP to 4.8 percent, but it remains slightly below pre-recession levels. (See Figure 2.)
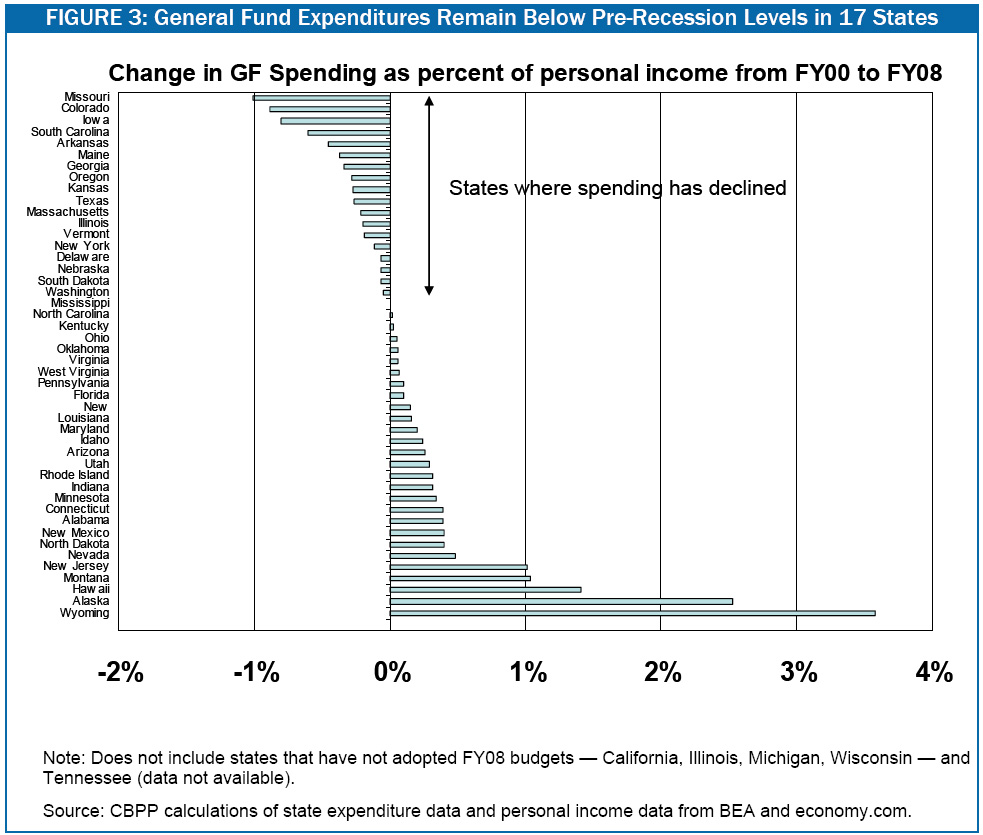
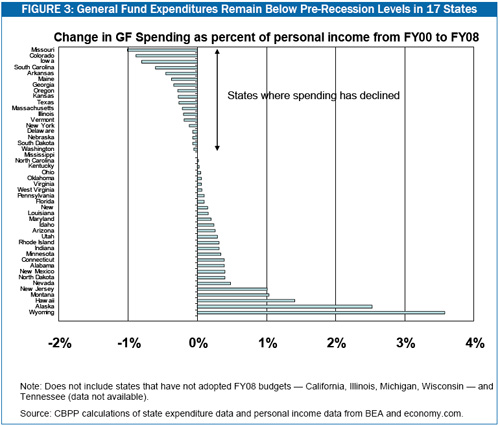
The fiscal year 2008 data suggest that many — but far from all — states have been able to catch up to pre-recession levels of spending. Six years into the economic recovery, some 17 states (out of the 46 that have enacted fiscal year 2008 budgets) have state expenditures below fiscal year 2000 levels as a share of the state’s economy. Of those states that have completed their fiscal year 2008 budgets, spending is furthest below fiscal year 2000 levels in Missouri, Colorado, Iowa, South Carolina, Arkansas, Maine, Georgia, Kansas, Oregon, and Texas. (See Figure 3.)
The slowdown in expenditure growth reflects in part policymakers’ recognition that state revenue growth appears to be slowing. The Rockefeller Institute’s survey of state tax collections shows that tax revenues for the first three quarters of fiscal year 2007 averaged 4.6 percent above the previous year. This was well below the growth rates for fiscal year 2006 (8.4 percent) and fiscal year 2005 (10.3 percent). State sales taxes — one of states’ two major revenue sources — were especially weak in fiscal year 2007 and now constitute a much smaller share of GDP than they did in the mid-1990s. This trend may foreshadow problems ahead for state budgets. Should revenue growth continue to weaken, states will have increasing difficulty balancing their budgets in coming years.
Click the image to view larger version
Another reason state expenditure growth has slowed is a decline in state fund balances carried over from one budget year to the next. To some extent, states’ recent expenditure growth depended on the use of one-time funds that resulted from conservative revenue estimates. As the economy improved, states’ actual revenue collections exceeded their projections. As a result many states ended their fiscal years with fund balances. These balances could have been placed in a rainy day fund or otherwise been left unspent in order to provide a cushion to help states weather future economic downturns, natural disasters or other unexpected budget pressures that occur after budgets are adopted. In many cases, however, states did not maintain these “reserves” but rather carried these funds over to the following budget year and then spent them as if they were ongoing revenues. Although this practice is legitimate, it cannot be sustained once revenues stop exceeding projections and will be particularly problematic if a recession hits.
At the end of fiscal year 2006, state General Fund balances totaled about 11 percent of total state spending, roughly the same level of reserves states had on hand going into the last recession — and an amount that proved inadequate to avoid major spending cuts. Most states’ rainy day funds are well below 15 percent of the state’s annual spending, the threshold that the Government Finance Officers Association suggests is prudent and that CBPP research suggests would be needed for a state to weather a recession. Despite this, these balances are projected to begin declining in fiscal year 2007 as states use part of their reserves to balance their budgets.
There are signs in specific states that fiscal problems may be imminent. Just one month into the new fiscal year, reports of fiscal stress have begun to surface in some states:
- Maryland’s governor recently announced spending reductions to balance the fiscal year 2008 budget and called for revenue increases to address a projected gap in fiscal year 2009 of more than $1 billion.
- California’s Legislative Analyst’s Office warns that the state will face operating shortfalls (gaps between ongoing revenues and ongoing expenditures) of $5 billion in both fiscal year 2009 and fiscal year 2010.
- Illinois and New Jersey continue to face fiscal problems resulting in part from the need to restore deposits into state employee pension trust funds postponed during the fiscal crisis.
It is too early to know whether states are headed into another downturn or whether revenue growth will pick up again. But we do know that there are ways that states can avoid repeating the erratic pattern of expenditure growth of the last six years. States can chart a more even course in the future if they plan on a multi-year horizon that takes expected spending and revenues into account. This gives them time to adjust to upcoming problems and develop systematic plans to fund needed improvements in health care, education, transportation and other areas.
End Notes:
Elizabeth McNichol and Brian Filipowich, Rainy Day Funds: Opportunities for Reform, Center on Budget and Policy Priorities, April 2007. |