
STATES’ HEAVY RELIANCE ON SPENDING CUTS AND
ONE-TIME MEASURES
TO CLOSE THEIR BUDGET GAPS LEAVES PROGRAMS AT RISK
by Elizabeth McNichol
| PDF of analysis |
|
| If you cannot access the files through the links, right-click on the underlined text, click "Save Link As," download to your directory, and open the document in Adobe Acrobat Reader. |
Between fiscal year 2002 and fiscal year 2004, states faced budget gaps that totaled close to $200 billion. States are required by law or tradition to balance their budgets. As a result, states cut spending, drew down their reserves, raised taxes and used one-time measures such as borrowing, federal fiscal relief and payment date shifts to close those gaps.
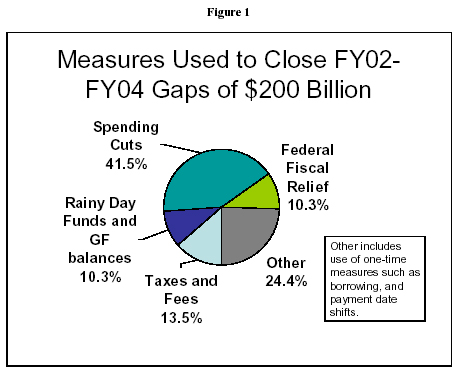
This analysis finds that states relied heavily on spending cuts and short-term measures to close budget gaps. [1] Revenue increases were a relatively small part of the solutions adopted. On average, states were three times more likely to rely on spending cuts to close deficits than on revenue increases.
- Spending cuts made up 42 percent of the measures.
- Rainy day funds were used to close 10 percent of the gaps.
- Other solutions — generally short-term provisions including federal fiscal relief — accounted for the remaining gap-closing measures. Assuming that most states used the federal fiscal relief funds by the end of fiscal year 2004, they accounted for 10 percent of gap-closing measures. Other measures including securitization of tobacco settlement payments, borrowing and sales of assets and payment date shifts made up the remaining 24 percent.
The most recent fiscal crisis was handled differently from the budget problems resulting from the last recession. In the early 1990s, the mix of solutions was more even – about one-third of the gaps were closed using tax increases; about one-third with spending cuts; and the remainder with reserves and other measures. This helped states return to fiscal health relatively quickly in the mid 1990s.
By contrast, the choices states have made in the current decade are serving to prolong the current crisis. The heavy reliance on one-time measures will make it harder for states to return to pre-recession budget levels. States will need considerably higher than average growth in future years to generate revenues sufficient to fund the normal level of programs and restore the cuts of the past few years. On average, states would need to see growth of two or more times normal to restore revenues to their pre-recession levels. While their revenues have stopped declining, states have not yet seen revenue growth of this magnitude.
How Did States Close Their Budget Gaps?
States relied on a host of measures to close budget gaps between fiscal year 2002 and 2004.
|
|
Cumulative Totals FY02 through FY04 |
|
|
|
Amt in billions |
Percent |
|
Tax and fee increases |
$26.4 |
13.5% |
|
Use of Rainy Day Funds and GF balances |
$20.0 |
10.3% |
|
Spending Cuts |
$80.9 |
41.5% |
|
Federal Fiscal Relief |
$20.0 |
10.3% |
|
Other (includes use of one-time measures such as borrowing, federal fiscal relief, payment date shifts etc) |
$47.7 |
24.4% |
|
Total Gaps Closed |
$195.0 |
100.0% |
Rainy Day Funds and Reserves Provided an Initial Cushion
States initially turned to their rainy day funds and other general fund balances to close budget gaps. The use of rainy day funds and balances accounted for $20 billion (10.3 percent) of the measures taken to close the cumulative budget gaps of $195 billion that states faced in fiscal years 2002, 2003 and 2004.
Between the end of fiscal year 2001 and the end of fiscal year 2004, total ending balances — which includes both general fund balances and rainy day fund balances — declined from $39.2 billion to $19.1 billion. Some 16 states addressed one third or more of their 2002 deficit with rainy day fund withdrawals. Fiscal year 2003 budgets further reduced reserve balances. Overall, reserve balances have declined from 10.4 percent of budgets at their most recent peak at the end of fiscal year 2000 to a projected 3.7 percent at the end of fiscal year 2004.
The remaining unused balances were heavily concentrated in a few states, and in most of these states at least a portion of the balance is difficult to access due to restrictions placed on the use of rainy day funds and general fund balances.[2]
State Spending Was Cut Significantly
States relied heavily on spending cuts to balance their budgets over the last three years. Some $80.9 billion (41.5 percent) of the cumulative gap of $195 billion was closed through spending reductions.
Since fiscal year 2001, state spending has declined significantly. By fiscal year 2004 state spending had dropped to its lowest share of the economy — as measured by gross domestic product — in almost 15 years.
Since January 2001, some 23 states have made policy changes that reduce the availability of child care subsidies for low-income working families. In about half the states, low-income families who are eligible for and need child care assistance are either not allowed to apply or are placed on a waiting list
While states usually show great reluctance to cut K-12 education, 11 states made cuts for fiscal year 2004, following 9 that did so the previous year. In 34 states, real per-pupil aid to school districts has declined since 2002; in 19 states the decline exceeds 5 percent. This has resulted in imposition of new or higher fees for textbooks and courses, shorter school days, reduced personnel, reduced transportation, and a variety of other types of cutbacks. And states throughout the country are cutting higher education, leading to double digit increases in public college and university tuition and significantly reduced course offerings, creating barriers to a higher education for low- and moderate-income families.[3]
Most States Raised Taxes and/or Fees to Some Extent
Most states have raised taxes and/or fees as a part of balancing their budgets during the fiscal crisis but the size of the increases has been relatively small. In total, tax and fee increases accounted for some $26.4 billion (13.5 percent) of the total gap-closing measures states used in fiscal years 2002 through 2004.
Since late 2001, about 29 states have expanded their tax bases or increased tax rates to lessen the decline in revenues. When fully implemented, the tax increases will raise some $19.2 billion per year that otherwise would have not been collected, an amount equal to about 3.5 percent of total state tax collections.[4]
Other Measures Including Short-term Fixes Were a Large Part of the Solution
States closed a significant portion of their budget gaps with short-term measures in hopes that the economy would turn up again quickly and revenues would grow rapidly. In total, these measures made up $67.7 billion (34.7 percent) of the gap-closing measures used by states. This included the use of the $20 billion in federal fiscal relief authorized in the spring of 2003. While detailed information on states’ use of fiscal relief funds is not available it is reasonable to assume that states had used most of these funds by the end of fiscal year 2004.[5] The $20 billion of federal fiscal relief accounted for 10 percent of gap-closing measures. Other measures made up the remaining 24.4 percent. These measures included borrowing and the securitization of tobacco settlement payments. In addition, states relied on accounting “gimmicks” such as moving payment dates into the following fiscal year or accelerating tax or fee collections. Some states sold assets such as state-owned buildings or land.
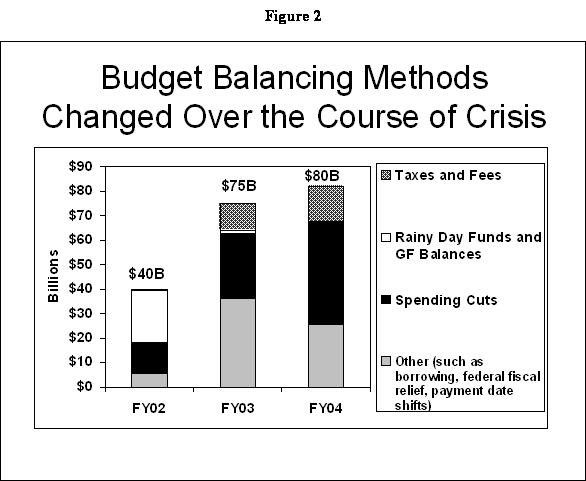
The Mix of Gap-Closing Measures Changed as Fiscal Crisis Dragged On
States relied on different methods to close their budget gaps in fiscal year 2002 — the first year of the fiscal crisis — than they did in subsequent years.
Fiscal Year 2002 - The fiscal crisis was first felt by states during the course of the 2002 fiscal year. States had adopted budgets based on revenue estimates that later proved too optimistic as the economic downturn began to affect collections. In this first year of the fiscal crisis, states were able to rely to a significant degree on their rainy day funds and balances in their general funds to support their budgets. However, because the revenue decline was so severe, states also cut spending by some $12.5 billion mid-year in the budget cycle. Very few states turned to revenue increases; they hoped that the downturn would be short and revenue measures would not be necessary.
Fiscal Year 2003 - By the second year of the fiscal crisis — fiscal year 2003 — state officials realized that this was a continuing crisis and had more time to develop solutions. The mix of gap-closing measures changed. Rainy day fund withdrawals were limited to $1.2 billion, since the funds had been mostly depleted in the first year of the fiscal crisis.
Revenue
increases were adopted by a number of states.
Fiscal Year 2004 - By fiscal year 2004, the third year of fiscal crisis, state rainy day funds were effectively depleted, states were running out of short-term measures and revenues continued to decline. States faced budget gaps totaling $80 billion. To fill these gaps states turned to additional tax and fee increases totaling some $15 billion. States also came up with additional short-term measures sufficient to close about $26 billion of the gap. But this left more than half the gap to be closed by spending cuts.
Implications for the Future
The heavy reliance by the states on short-term measures and spending cuts to balance their budgets means that state programs continue to be squeezed, despite the improvements in the economy. At the start of fiscal year 2005 budget deliberations, states faced gaps of $36 to $40 billion in their budgets.
While state revenues have since to grow again as states near the end of the 2004 fiscal year, the use of one-time measures combined with the depressed revenue base will make it difficult for states to return to pre-recession budget levels. States will need considerably higher than average growth to generate revenues sufficient to restore the cuts of the past few years and return program funding to normal levels.
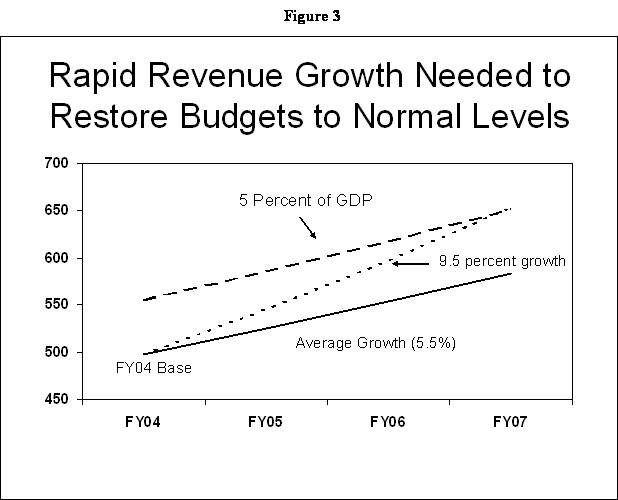
Figure 3 illustrates the problem that states face. The top (dashed) line shows the amount of revenue that states would be generating each year from fiscal year 2004 to fiscal year 2007 if revenue equaled the same percent of GDP that it equaled on average in the mid 1990s. The bottom (solid) line shows estimated revenues based on average growth from the actual revenue collections for fiscal year 2004.[6] The figures for the years after 2004 are estimated by applying the average revenue growth of the mid-1990s to the 2004 base. If revenues grow no faster than average from the depressed revenue base of fiscal year 2004, they will remain well below pre-recession levels for the foreseeable future. States would need annual revenue growth of about 9.5 percent for three years — or 12 percent for two years — to restore revenues to their pre-recession levels. Growth in that range is about twice the average revenue growth of 5.5 percent. It seems unlikely that sustained revenue growth at this level will be seen; even during the economic boom of the 1990s state tax growth exceeded 10 percent in only one quarter.
Conclusion
The measures that states used to close their budget gaps combined with the severity of the fiscal crisis that states faced suggest that state services will remain at risk for a number of years. During the 1990s state spending grew at the same pace as the economy grew. States had sufficient revenue to accommodate increasing costs such as rising health costs and growing school enrollments. In addition, in response to public demand, many states were able to increase their investment in primary and elementary schools, reduce reliance on local property taxes, expand health coverage for low-income children and their families and expand access to higher education. Some of this progress was rolled back as states cut their budgets over the last three years. Unless state revenues soon begin to grow much faster than average states will not be able to restore these cuts for a long time.
|
|
Fiscal Year 2002 |
Fiscal Year 2003 |
Fiscal Year 2004 |
|||
|
|
Amount (billions) |
Percent |
Amount (billions) |
Percent |
Amount (billions) |
Percent |
|
Tax and fee increases |
$0.9 |
2.2% |
$11.0 |
14.7% |
$14.5 |
18.1% |
|
Use of Rainy Day Funds and General Fund balances |
$20.9 |
52.2% |
$1.2 |
1.6% |
-$2.0 |
-2.5% |
|
Spending Cuts |
$12.5 |
31.1% |
$26.6 |
35.5% |
$41.8 |
52.2% |
|
Other (includes use of one-time measures such as borrowing, federal fiscal relief, payment date shifts etc) |
$5.8 |
14.4% |
$36.2 |
48.3% |
$25.7 |
32.2% |
|
Total Gap Closed |
$40.0 |
100.0% |
$75.0 |
100.0% |
$80.0 |
100.0% |
Methodology
The methods used to estimate how each year’s budget gap was closed differed by type of measure and by year in some cases. All amounts reflect general fund spending and revenues.
Tax and fee increases:
Fiscal year 2002: Net tax and fee changes as reported in the Fiscal Survey of the States published in December 2001 by the National Association of State Budget Officers.
Fiscal years 2003 and 2004: Center on Budget and Policy Priorities calculations of new tax increases based on information collected by the National Conference of State Legislatures (See State Revenues Have Fallen Dramatically, November 25, 2003 for more detail) plus total fee increases reported by the National Association of State Budget Officers.
Use of Rainy Day Funds and General Fund Balances:
Fiscal years 2002, 2003 and 2004: For each fiscal year the amount of Rainy Day Fund used equals the prior year’s end-of-year balance including rainy day funds minus the current year end-of-year balance including rainy day funds. End of year balances are taken from NASBO’s Fiscal Survey of the States.
Spending Cuts:
Fiscal year 2002: Because the spending reductions for fiscal year 2002 occurred mid-year, the amount was estimated by subtracting the actual spending for fiscal year 2002 budgets from the spending in adopted fiscal year 2002 as reported in NASBO’s Fiscal Survey of the States for December 2001 and December 2002.
Fiscal years 2003 and 2004: For these years it was necessary to estimate a “Current Services” baseline spending amount for each year. (Current Services refers to the amount of spending that would be required to fund existing state programs at the same level after accounting for increases in costs due to inflation and caseload growth but not new legislation.) The spending cut was then estimated by subtracting the actual spending for the fiscal year from the Current Services spending estimate.
For each fiscal year, the current service estimate was calculated by applying a growth factor to actual FY2002 spending. Starting that year spending was increased each year by population plus inflation growth plus an additional 2 percent. This factor equals the average increase in state general fund spending during the 1990s.
Other
Fiscal years 2002, 2003 and 2004: The difference between the total spending gap for each year as reported by the National Conference of State Legislatures and the amount closed by the three methods listed above.
End Notes:
[1] The methods used to obtain these estimates are summarized at the end of this brief. While there are a number of sources of information on state budget and tax actions over the last three, no summary exists of the combination of measures states used to close their budget gaps. The following tables and charts use estimates based on information from surveys of state budget officials to give a picture. The amounts are estimated in some cases but the results in general agree with the observations of policy analysts and public officials who follow state budget and tax trends.
[2] For more
detail on state use of rainy day funds and reserves see the
Center publication “Heavy Weather: Are State Rainy Day Funds
Working?” by Bob Zahradnik and
[3] For more
details on state spending cuts, see “Fiscal Crisis is
Shrinking State
[4] For more
information, see “State Revenues have Fallen Dramatically:
[5] Congress approved the federal fiscal relief in the spring of 2003 — towards the end of fiscal year 2003 for most states. Half of the funds ($10 billion) were designated for Medicaid costs. These funds were distributed through an increase in the Medicaid matching rate from April 2003 to June 2004. The other half of the funds could be used for any expenditures included in the state’s most recent budget. The Treasury Department made payments to each state upon certification that the funds would be used in a way consistent with the federal act. These payments were available in June 2003 and October 2003. Thus the first was available at the end of state fiscal year 2003 and the second at the beginning of state fiscal year 2004.
[6] Estimated revenue collections are shown for fiscal year 2004.