|
Revised October 13, 2006
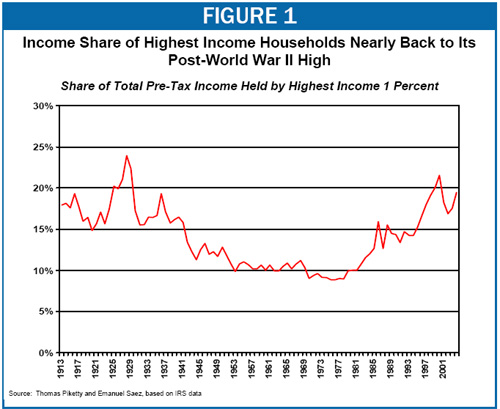
NEW DATA SHOW EXTRAORDINARY JUMP IN INCOME CONCENTRATION IN 2004
By Aviva Aron-Dine and Isaac Shapiro
Economists Thomas Piketty and Emmanuel Saez have recently made available an updated version of their groundbreaking data series on U.S. income inequality.[1] The data are unique because of the detailed information they provide regarding income gains at the top of the income spectrum, and also because they extend back to 1913. By contrast, widely used Census data on income developments do not capture income trends among the top one percent of households and go back only to the end of World War II. CBO data, which do capture income trends among the top one percent, show there was a substantial increase in income concentration between 2002 and 2003, but those data do not yet extend beyond 2003.[2]
The Piketty and Saez data offer the first real snapshot of income trends among those at the pinnacle of the income spectrum in 2004. The data show that income gains between 2003 and 2004 were particularly large for those at the very top of the income spectrum, resulting in a nearly unprecedented one-year increase in income concentration.[3] The Piketty and Saez data show:
-
From 2003 to 2004, the average incomes of the bottom 99 percent of households grew by less than 3 percent, after adjusting for inflation. In contrast, the average incomes of the top one percent of households experienced a jump of more than 18 percent, after adjusting for inflation. (Census data show that real median income fell between 2003 and 2004. Average income is pulled up by gains at the top of the income spectrum; much of the 2.3 percent rise among the bottom 99 percent seems to largely reflects gains by households in the top decile of the income spectrum. In contrast, trends in median income capture the experience of households in the middle of the income spectrum.)
-
This disparity produced an exceptional jump in income concentration in 2004. The share of the pre-tax income in the nation that goes to the top one percent of households increased from 17.5 percent in 2003 to 19.8 percent in 2004. Only five times since 1913 (the first year that this data set covers), and only twice since World War II has the top one percent’s share risen by as much in a single year (in percentage point terms). Each percentage point of income is equivalent to $69 billion in 2004.
Income gains were even more pronounced among those with the very highest incomes. The incomes of the top one-tenth of one percent of households grew more rapidly than the incomes of the top one percent of households. The share of the national income received by the top one tenth of one percent of households increased by 1.6 percentage points from 2003 to 2004; in other words, more than half of the increased share of income going to the top one percent of households actually went to the top one-tenth of one percent of households. (See Table 1.)
The Piketty and Saez data provide valuable insight into the distribution of gains in income during the current economic expansion. The incomes of nearly all groups fell in 2001 and 2002, according to CBO data. The incomes of those at the top of the income spectrum fell by the largest percentage (at least in part as a result of the decline in the stock market), and their share of the total income consequently declined. In 2003, however, when income growth resumed, so did the long-term trend toward increased income inequality.
|
Table 1: Change in Income Shares, 2003-2004 |
|
Share of Households |
Share of National Pre-tax Income, 2003 |
Share of National Pre-tax Income, 2004 |
Percentage Point Change |
|
Bottom 99% |
82.5% |
80.2% |
-2.2 |
|
Top 1% |
17.5% |
19.8% |
+2.2 |
|
Top Tenth of 1% |
7.9% |
9.5% |
+1.6 |
|
Note: A percentage point of income was equivalent to $69 billion in 2004.
Figures may not add due to rounding. |
|
Alan Greenspan Has Expressed Concerns about Rising Income Inequality
Former Federal Reserve Chairman Alan Greenspan has frequently raised concerns about the long-term trend towards increased income inequality and evidence that this trend is continuing. In July 2005 Congressional testimony, for example, Greenspan said that there is a “really serious problem here, as I’ve mentioned many times before this [House] committee, in the consequent concentration of income that is rising.”a
a Federal Reserve Board Chairman Alan Greenspan, Testimony before the House Financial Services Committee, July 20, 2005. |
The Piketty and Saez data indicate that the increase in income concentration shown in the CBO data for 2003 was not a one-year blip. Income growth was stronger in 2004 than in 2003, but the gains were distributed only more unevenly. After capturing 36 percent of the income growth in the nation in 2003, the top 1 percent captured 53 percent of the income growth in 2004.[4]
The new data from Piketty and Saez are fully consistent with other indicators that suggest the distribution of the economic gains from the current recovery has been very uneven. In May 2006, CBO suggested that continued growth in income inequality may be one cause of the recent rapid growth in federal revenues.[5] Increases in income inequality boost revenue growth, in part because high-income households are subject to higher federal income tax rates than are households of lesser means.
It should be noted that wage and salary growth has been unusually weak during this recovery, while the growth of corporate profits has been exceptionally strong. This contributes to growing income inequality, since high-income households own a highly disproportionate share of corporate assets and derive significant income from those assets. With stronger-than-normal growth in corporate profits having continued into the first part of 2006, it may well be the case that the increase in income inequality that Piketty and Saez have documented through 2004 has continued since that time and that the nation’s already-large disparities in income are growing yet wider.
End Notes:
[1] Piketty and Saez rely on detailed Internal Revenue Service micro-files for most years, but use more aggregated IRS data and statistical techniques to extend their series back to 1913 and forward to 2004 (years for which detailed micro-files are not available). In September 2006, they revised their 2004 estimates to reflect additional, newly available IRS data. For details, see Thomas Piketty and Emmanuel Saez, “Income Inequality in the United States: 1913-1998,” Quarterly Journal of Economics, February 2003, http://elsa.berkeley.edu/~saez/pikettyqje.pdf. The updated data series is available at http://elsa.berkeley.edu/~saez/TabFig2004prel.xls.
[2] Congressional Budget Office, “Historical Effective Tax Rates: 1979-2003,” December 2005 and Isaac Shapiro and Joel Friedman, “New CBO Data Indicate Long-Term Growth in Income Inequality Continues,” Center on Budget and Policy Priorities, January 29, 2006.
[3] Piketty and Saez present several different data series. We focus on the series that includes capital gains income. The trends described here are not affected by this inclusion; essentially the same trends hold if capital gains income is excluded.
[4] Note that the share of income growth captured by the top 1 percent in 2004 was more than twice their share of income in 2003. This is why this group’s share of income increased so dramatically between 2003 and 2004.
[5] Congressional Budget Office, Monthly Budget Review, May 4, 2006. |