
As a Share of the Economy and the Budget, U.S.
Development and Humanitarian Aid Would Drop to Post-WWII Lows in 2002
by Isaac Shapiro
| PDF of full report HTML of press release PDF version of press release If you cannot access the files through the links, right-click on the underlined text, click "Save Link As," download to your directory, and open the document in Adobe Acrobat Reader. |
The amount of federal funds devoted to development, humanitarian, or economic aid to other countries has fallen substantially since the early 1960s. By some measures, federal expenditures for such aid had fallen by the end of the 1990s to record low levels. Furthermore, for some time, the share of national resources the United States contributes in aid to the world's poorest nations has been far lower than the share any other industrialized country contributes.
Spending on U.S. development, humanitarian, and economic aid — referred to throughout this analysis by the short-hand term "development aid" — increased modestly in fiscal year 2000, and will increase modestly again in 2001.(1) Under the Bush Administration's budget, however, development aid spending in 2002 would be $380 million below its 2001 level, after adjusting for inflation.(2) Expenditures for development aid in 2002 would fall to their lowest levels since the end of World War II, according to two key indicators. (The level of development aid spending for 2002 in the Administration's budget is virtually identical to the 2002 level in the Office of Management and Budget "baseline;" the baseline is discussed further on page 5.)
1980s Average |
In 2002 under Administration’s Budget |
Comment on |
|
| Inflation-adjusted
level (in 2002 dollars) |
$13.4 billion |
$10.9 billion |
Significantly below historic average |
| As a share of the economy | 0.20% |
0.10% |
Post-World War II low |
| As a share of the budget | 0.92% |
0.56% |
Post-World War II low |
| Source: Center on Budget and Policy Priorities analysis of data from the Office of Management and Budget and U.S. AID | |||
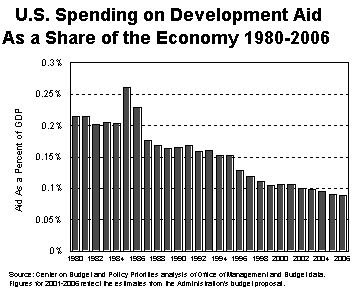
- Under the Administration's budget, the United States would devote resources equal to only 0.10 percent of the U.S. economy to development aid in 2002.(3) Measured as a share of the economy, this would represent the smallest share of national resources devoted to development aid in the post-World War II era. The share of the economy dedicated to development aid has fallen by half since the 1980s. The decline is even larger when measured over a longer period.
- Measured as a share of the federal budget, development aid would equal 0.56 percent of total federal expenditures in 2002. That would be lower than the share of the budget devoted to development aid at any time on record.(4)
Congress could choose to allocate significantly more funds to development aid than the Administration proposes, but the early stages of the Congressional budget process do not provide evidence of such an intent on Congress' part. While Congressional Committees have not yet voted on specific levels for development aid spending, the initial indications are that Congress will provide funding levels similar to those proposed by the Administration.
This analysis also examines data from the Organization for Economic Co-operation and Development (OECD). These data enable U.S. aid expenditures targeted on poor countries to be compared with the amounts contributed by other OECD donor countries, such as France, Germany, Japan, and the United Kingdom.
- The United States ranks the lowest of all 22 OECD countries examined in the share of the economy devoted to development aid for poor countries. The latest comparative data extend through 1999. In the 1998-1999 period, development aid, measured as a percentage of the economy, was three times greater in the typical OECD country than in the United States.
- According to these data, for every individual in the United States, our country contributed an average of $33 a year in development aid to poor countries in 1998-1999. This was the third lowest level of per capita contributions among the 22 OECD countries examined.
OECD data on development aid as a share of the economy are available back to 1950. The budget office of the U.S. Agency for International Development tracks U.S. economic assistance back to 1946.(5) The definition of assistance that AID uses differs somewhat from the definition the OECD uses and also differs from the definition reflected in the OMB data that are the primary source of information for this report (and which are available from 1962 onward). Nevertheless, in combination, the data from these three sources indicate that under the Administration's budget U.S. development aid in 2002 would be at its lowest level since the end of World War II, measured both as a share of the economy and as a share of the budget.(6)
These findings also are consistent with a Congressional Budget Office report that tracked foreign aid through 1997, using a definition of aid that includes military assistance. CBO found that "U.S. spending on foreign aid has fluctuated from year to year but has been on a downward path since the 1960s."(7) CBO also reported that "as a percentage of federal outlays, U.S. spending on foreign aid reached its lowest level in the post-World War II era in 1997."
This analysis also briefly examines how resources and living standards in the United States compare with those of other nations. On average, each person in the United States has 75 times the average annual income of each person in the world's low-income countries. The World Bank estimates that 1.2 billion people in developing or transitional countries live on less than $1 a day. For every person in the United States, there are four people in the rest of the world living on less than $1 a day.
These trends and international comparisons provide some context for deliberations that will occur in coming months concerning what level of funding to provide for U.S. development, humanitarian, and economic aid in 2002. The United States would have to increase its aid commitment substantially to reach the levels that other wealthy nations provide or to return to its own level of commitment in earlier decades.
Before proceeding with the body of this analysis, it should be made clear at the outset that this analysis focuses on the important, but limited, question of the overall level of assistance the United States devotes to development aid to other countries, especially poor countries. Other important questions concerning development aid — such as the effectiveness of such aid, how its effectiveness can be strengthened, and how the United States might better target its aid — are beyond this paper's scope. This paper also does not investigate the factors that have affected the ebb and flow of aid, such as Middle East agreements or the break up of the Soviet Union. In and of itself, however, a discussion of the overall size of the national commitment to development aid over time provides helpful information about the nature of our government's budget priorities.
Trends in U.S. Spending Levels
Development aid can be defined and measured in a number of ways. The definition used here begins with the budget category called "International Development and Humanitarian Assistance." This category includes funding for areas such as bilateral development aid, assistance to countries in transition (mainly those that once were part of the former Soviet Union), certain contributions to multilateral institutions that can be used for development aid (such as funds for the development finance division of the World Bank), the Child Survival and Disease Program, humanitarian aid, emergency relief, and efforts to combat the drug trade. Our focus here is on discretionary spending in these areas.(8) Some of the areas that fall into this government budget category are not purely "development aid" in that their main goal is not to help improve the economies of the nation's poorest countries.
In addition, the definition of development aid used here includes assistance under the Economic Support Fund (which does not fall into the category of "International Development and Humanitarian Assistance"). The Economic Support Fund consists of economic assistance the United States provides to foreign countries based on considerations of special economic, political or security needs and U.S. interests. The countries that receive funds from the Economic Support Fund are specifically chosen for their strategic importance, and not all of these funds are targeted on development. Still, since the economic aid that countries receive from the Economic Support Fund can assist economic development, this paper errs on the side of a too-inclusive definition and includes ESF funds in its analysis. In this respect, the figures used here overstate the degree of U.S. development aid. (This analysis does not treat military assistance as part of development aid.)
The budget proposal of the Bush Administration adheres closely to the spending path established by budget decisions in prior years, with some modest improvements. The amount of spending on development aid the budget proposes for 2002 is essentially identical to the level reflected in the Office of Management and Budget "baseline;" the proposed level is one-tenth of one percent lower than the baseline level. (The baseline reflects the level of expenditures in 2002 and subsequent years if appropriations — or, more technically, "budget authority" — in 2002 and subsequent years equal the 2001 appropriations level, adjusted for inflation.) The amounts the budget proposes for development aid spending would be 1.4 percent over the baseline by 2006. Even so, these levels would be spartan when considered in historical perspective.
- During the 1980s, U.S. discretionary spending for development aid averaged $13.4 billion. (This and the other figures in this section of the paper are adjusted for inflation and expressed in 2002 dollars. Year-by-year data can be found in Appendix 1.)
Adjusted for inflation, aid levels remained fairly constant during the first half of the 1990s, before dropping in the latter half of the 1990s.(9) Development aid declined to $10.5 billion in 1999, before rising to a projected $11.3 billion in 2001, in part reflecting temporary disaster assistance related to Hurricane Mitch as well as some other temporary increases in spending.
Under the Administration's budget, this figure would drop to $10.9 billion in 2002, well below its historic average. (This decline in development aid "outlays" from 2001 to 2002 does not reflect a decline in "budget authority" from 2001 to 2002. Budget authority increases slightly faster than the rate of inflation from 2001 to 2002. See the box on the next page for an explanation of this seeming incongruity.)
- U.S. development aid will equal 0.11 percent of the U.S. economy in 2001. Under the Bush budget, it would equal 0.10 percent of the economy in 2002, which would be the lowest share since the end of World War II. During the 1980s, development aid as a share of GDP averaged 0.20 percent, double its estimated 2002 share. The decline in this measure is still greater if the comparison is with expenditure levels in earlier years.(10)
Trends in "Budget Authority" Versus Trends in "Budget Outlays" As noted in the text, the decline in development aid spending (or outlays) from 2001 to 2002 does not reflect a decline in "budget authority." Budget authority is the amount of money appropriated for a particular area; not all of the funds appropriated in a fiscal year need to be spent in that fiscal year. Often times, it can take several years or more to expend funds that have been appropriated. In 1999, there was a jump in budget authority for development aid that led to an increase in outlays in 2000 and 2001. Budget authority for development aid subsequently declined in 2000 and 2001. The decline in budget authority in 2000 and 2001 helps explain why development aid outlays would fall relative to inflation in 2002 even though under the Bush budget, budget authority for 2002 would increase. In nominal terms, budget authority for development aid would be 3.2 percent higher in 2002 than in 2001, an increase somewhat larger than the expected rate of inflation. |
- Development aid also consumes a much smaller portion of the federal budget than in the past. Under the Administration's budget, development aid would edge down from 0.59 percent of federal expenditures in 2001 to 0.56 percent in 2002, a post-World War II low. During the 1980s, development aid averaged 0.92 percent of federal spending.
The Bush budget also includes its planned levels of development spending for 2003 through 2006. Under the budget, development aid spending would fall further as a percentage of the economy and of federal spending, as well as falling slightly further in inflation-adjusted terms.
It bears noting that overall discretionary spending on international affairs — which also includes military aid, contributions to the United Nations and other international organizations, and general State Department operations — would increase by about two percent over the next five years under the budget, relative to the baseline. Nevertheless, in 2002 overall international spending would be a smaller share of the economy and of total federal spending than in any year from 1962 to 1997. International affairs spending would decline further under these measures after 2002. By 2004, international affairs spending as a share of the economy would be at its lowest level on record. (These OMB data go back to 1962.)
Ultimately, it will be the decisions that Congress makes that will establish spending levels on international affairs in 2002 and beyond. The best evidence now available of Congress' intentions in this area consists of the "302 (b)" allocations made by the Appropriations Committees to their subcommittees. In the House, the overall allocation level to the Foreign Affairs subcommittee is identical to the request made by the Bush Administration. The Senate allocation is two percent, or $356 million, higher than the House and Bush figure. It is impossible to determine with precision what these initial allocations imply for development aid spending since some of the funds for the Foreign Affairs subcommittee are spent on purposes other than development aid and because not all development aid spending is under the jurisdiction of this subcommittee. Still, these overall allocation levels suggest that, so far, Congress is on course to provide a similar, though perhaps slightly higher, level of development aid as that proposed by the Bush administration.
U.S. Compared with Other OECD Countries
The Organization for Economic Co-operation and Development (OECD) is the authoritative source for information comparing the extent to which various industrialized nations devote resources to development assistance. The OECD examines the amount of development assistance provided each year by the members of the Development Assistance Committee, which is comprised of 22 countries, including the United States, Canada, France, Germany, Japan, and the United Kingdom.(11)
The measure of assistance to which the OECD accords most attention is "Official Development Assistance" (ODA), which consists of development aid to the world's poorest countries, as identified by the United Nations.(12) The OECD recently released data on this measure through 1999.(13)
These data show that the share of Official Development Assistance world-wide that the United States contributes has dropped dramatically over the past four decades. (In the following data, the OECD practice of combining and averaging two years to help smooth out yearly fluctuations is often employed.)
- Between 1950 (the earliest year for which this information is readily available) and 1968, the United States contributed more than half of the Official Development Assistance provided by the countries on OECD's Development Assistance Committee. By 1978-79, the United States was contributing one-fourth of ODA (25 percent); by the 1998-99 period, the U.S. contribution equaled 16.5 percent of ODA, or one-sixth of it.(14)
- In absolute dollars, the United States is not the largest source of ODA. Japan, with an economy less than half the size of ours, is now a bigger contributor. The United States is the second largest contributor in total dollars.
- The United Nations has established an Official Development Assistance target for donor countries of 0.7 percent of Gross National Product.(15) In the 1998-1999 period, four of the 22 countries that the OECD examined — Denmark, Netherlands, Norway, and Sweden — met or exceeded this goal. By contrast, an amount equal to 0.10 percent of the U.S. economy went to ODA in 1998-1999, one-seventh of the U.N. goal.
- In the 1998-1999 period, the typical or "median" country examined contributed an amount equal to 0.3 percent of GNP to Official Development Assistance. (In other words, half of all countries contributed a larger share than this amount, while half contributed a smaller share.) The U.S. contribution level was one-third the median level.
- In 1998-1999, the United States contributed a smaller share of its economy to Official Development Assistance than any other country the OECD examined. Greece was the second lowest, contributing an amount equal to 0.15 percent of GNP.
United States |
Typical Donor Country* |
|
| ODA as a share of the economy | 0.10% |
0.30% |
| ODA per person in the donor country | $33 |
$69 |
| * Typical Donor
Country figures represent the median levels of the 21 countries other than the United
States examined by the OECD Source: Development Co-Operation, 2000 Report, OECD, 2001 |
||
Another way that the OECD measures national commitment to Official Development Assistance is by examining the amount of assistance extended on a per capita (that is, per person) basis. For each person in the United States, the United States contributed an average of $33 per year to ODA in the 1998-1999 period. The median country among the 22 nations the OECD examined contributed $69 on a per capita basis. (OECD expresses these figures in 1998 dollars.) On the high side, Denmark contributed $326 per person to ODA. Of the 21 countries, only Greece and Portugal — far poorer countries than the United States — contributed a smaller amount of funds on a per capita basis.(16)
How do Resources and Living Standards in the United States Compare with Those of Other Nations?
In assessing the relative level of resources the United States devotes to development aid, it is useful to examine the wealth of the United States relative to that of other countries, as well as how living standards here compare with those in countries to which we might provide assistance. World Bank data are particularly useful in this regard.(17)
- In 1999, GNP per capita was $30,600 in the United States. This was eight times the average of $3,700 per person in the rest of the world. For the 2.4 billion people living in the world's low-income countries, GNP averaged just $410 per person.
- In 1998, there were an estimated 1.2 billion people in developing or transitional countries who lived on less than $1 a day. These individuals accounted for nearly one in every four people in these countries.(18)
In South Asia alone (which includes India), an estimated 522 million people — 40 percent of the population — lived on less than $1 a day in 1998. In Sub-Saharan Africa, 291 million people — 46 percent of the population — did. The 291 million people in Sub-Saharan Africa who were this poor constitute a larger number of people than the entire U.S. population.
United Nations data provide some sense of the living conditions associated with such low levels of income.(19)
- In the United States, 13 percent of the population is not expected to survive to age 60. In South Asia, 30 percent of the population is not expected to live this long. In Sub-Saharan Africa, 56 percent of the population — more than four times the U.S. proportion — is not expected to reach age 60.
- In the United States, there are six cases of tuberculosis per 100,000 people. In both South Asia and Sub-Saharan Africa, there are about 100 such cases per 100,000 people. And as is well known, the AIDS virus is proving disastrous in Africa.
- The United States has 245 medical doctors for every 100,000 people. South Asia has 44. Sub-Saharan Africa has 32.
- The adult literacy rate is 99 percent in the United States. By comparison, 54 percent of South Asian adults and 60 percent of Sub-Saharan adults are literate.
- The Food and Agriculture Organization of the United Nations estimates that nearly 800 million people in the developing world are undernourished — that is, their "food intake does not provide enough calories to meet their basic energy requirements."
In the developing world, reflecting the inadequate food intake and poor health conditions, an estimated two or every five children are stunted (i.e., have significantly low height for their age), and one in three is underweight.
Conclusion
The trends in U.S. development aid are unmistakable. U.S.
spending on development aid has fallen significantly over time and is quite low now
compared with the levels that other industrialized nations provide. The Administration's
budget would continue this pattern; under it, development aid spending as a share of the
economy and as a share of the budget would fall to post-World War II lows. In the first
years of the 21st century, the United States would continue to contribute a
much smaller fraction of its resources to development, humanitarian, and economic aid for
poor countries than any other industrialized nation on the globe.
| Fiscal Year | Aid in 2002 Dollars (outlays in billions) | Aid as a percent of GDP | Aid as a percent of Budget Outlays |
| 1962 | $17.1 | 0.58% | 3.06% |
| 1963 | $16.2 | 0.53% | 2.83% |
| 1964 | $15.6 | 0.48% | 2.60% |
| 1965 | $15.5 | 0.45% | 2.61% |
| 1966 | $16.9 | 0.46% | 2.56% |
| 1967 | $16.2 | 0.42% | 2.16% |
| 1968 | $13.2 | 0.33% | 1.61% |
| 1969 | $11.6 | 0.27% | 1.42% |
| 1970 | $10.5 | 0.24% | 1.27% |
| 1971 | $9.6 | 0.22% | 1.13% |
| 1972 | $11.4 | 0.25% | 1.26% |
| 1973 | $10.1 | 0.20% | 1.09% |
| 1974 | $8.8 | 0.18% | 0.94% |
| 1975 | $10.8 | 0.22% | 1.03% |
| 1976 | $9.8 | 0.19% | 0.89% |
| 1977 | $11.3 | 0.21% | 1.00% |
| 1978 | $12.6 | 0.22% | 1.06% |
| 1979 | $12.0 | 0.20% | 1.00% |
| 1980 | $12.6 | 0.21% | 0.99% |
| 1980 | $12.8 | 0.21% | 0.97% |
| 1982 | $11.9 | 0.20% | 0.88% |
| 1983 | $12.5 | 0.21% | 0.88% |
| 1984 | $13.1 | 0.20% | 0.92% |
| 1985 | $17.4 | 0.26% | 1.14% |
| 1986 | $16.0 | 0.23% | 1.02% |
| 1987 | $12.7 | 0.18% | 0.82% |
| 1988 | $12.5 | 0.17% | 0.79% |
| 1989 | $12.6 | 0.16% | 0.77% |
| 1990 | $12.9 | 0.16% | 0.76% |
| 1991 | $13.0 | 0.17% | 0.75% |
| 1992 | $12.6 | 0.16% | 0.71% |
| 1993 | $13.1 | 0.16% | 0.75% |
| 1994 | $12.8 | 0.15% | 0.72% |
| 1995 | $13.3 | 0.15% | 0.74% |
| 1996 | $11.4 | 0.13% | 0.63% |
| 1997 | $11.0 | 0.12% | 0.61% |
| 1998 | $10.7 | 0.11% | 0.59% |
| 1999 | $10.5 | 0.11% | 0.56% |
| 2000 | $11.0 | 0.11% | 0.58% |
| 2001* | $11.3 | 0.11% | 0.59% |
| 2002* | $10.9 | 0.10% | 0.56% |
| 2003* | $10.9 | 0.10% | 0.56% |
| 2004* | $10.9 | 0.10% | 0.55% |
| 2005* | $10.6 | 0.09% | 0.53% |
| 2006* | $10.6 | 0.09% | 0.53% |
| *Data
for 2001 through 2006 are estimates from the Administration's budget proposal. Figures are
adjusted for inflation based on the CPI-URS from 1962-2000 and CBO's inflation projections
for 2001 on. Source: Center on Budget and Policy Priorities analysis of Office of Management and Budget data. |
|||
Appendix 2. Comparing pre-1992 Data to Data from 1992 On
Although the Office of Management and Budget provides annual data on discretionary spending for fiscal year 1962 onwards, the time series is not entirely consistent. The inconsistency reflects the difference in the budgetary treatment of loans prior to 1992 and from 1992 on.
Prior to 1992, loans were recorded in the budget on a cash basis; that is, the amount associated with making a loan equaled the cash disbursed. Similarly, principal repayments and interest paid on the loan were recorded on a cash basis as "negative spending," in other words, as a reduction in spending. As a result of the Federal Credit Reform Act of 1990, since 1992 loans have been treated on a subsidy basis; that is, the amount of spending associated with a loan equals the estimated amount of the subsidy provided by a loan. Principal repayments and interest paid on the loan are recorded in "non-budgetary" accounts and thus do not affect the spending recorded in the budget. OMB has found it "impossible to convert the pre-1992 loans to a credit reform basis," and thereby to construct a consistent time series.
As an example of the effects of these differences in treatment, take the hypothetical case of a loan of $1 million that involved a subsidy of $200,000.
- Prior to 1992 this loan would have been considered to result in outlays of $1 million in the year it was issued; since 1992 only the subsidy amount — $200,000 — is recorded in the budget in the year it is issued. So in the year issued the "same" loan was assumed to cost more in the pre-1992 period.
- In the years after the loan is issued, the effect works in the opposite direction. Prior to 1992, any principal or interest payments on the loan would have the effect of reducing spending as recorded in the budget. Since 1992, these payments are handled differently and do not affect discretionary spending on foreign economic aid. So in the years after the loan is issued, the same loan is assumed to cost less (since the payments would be recorded as negative funding) in the pre-1992 period.
The net effect on the measurement of foreign economic aid is difficult to determine. It depends on the nature of the loans issued, the timing of the repayments, and changes in the size of the loans over time. That is, we know the time series is not entirely consistent, but it is difficult to ascertain whether in comparing particular years this inconsistency leads to an overstatement or an understatement of the fall in economic aid over time.
Nevertheless, it is possible to state with confidence that foreign economic aid has declined since the 1960s, and in 2002 will be at the lowest levels on record as a share of the economy and government outlays. First, although the proportion of economic aid that consists of loans is now lower than it was, the data that are available suggest that loans were not the majority of foreign economic aid prior to 1992. U.S. AID data for the period from 1962 to 1993 indicate that 21 percent of their definition of foreign economic assistance consisted of loans, the other 79 percent consisted of grants. (AID did not break these data out on an annual basis.)
Second, the differences between now and the 1960s and 1970s are dramatic (because of the drop in loans during the 1980s, there is little reason to be concerned that comparing current spending to spending in the 1980s leads to an overstatement in the fall of foreign economic aid(20)), suggesting that an inconsistency of difficult-to-determine direction is unlikely to affect the basic trend. From 1962 to 1969 according to the definition of foreign economic aid used in this paper, it equaled between 0.27 percent and 0.58 percent of the economy; in the 1970s, foreign economic aid constituted between 0.18 percent and 0.25 percent of the economy; under the Bush budget it would equal 0.11 percent of the economy. The differences between now and then are so substantial that they are extremely likely to remain even if one were able to account for the loans on a consistent basis.
End Notes:
1. This analysis focuses on discretionary (non-entitlement) spending or "outlays."
2. Under the Administration's budget, "budget authority" for development aid in 2002 — the additional amount of resources to be appropriated for such aid, some of which would be spent in 2002 and some of which would be spent in subsequent years — would rise slightly relative to inflation, even though actual spending or "outlays" would decline. The distinction between outlays and budget authority is explained in more detail in the box on page 7.
3. The definition of development aid used here includes all discretionary spending within subfunction 151 of the federal budget (subfunction 151 is international development and humanitarian assistance), as well as the Economic Support Fund. The Economic Support Fund is part of subfunction 152, international security assistance.
4. The previous post-World War II low was set in 1999, when development aid equaled 0.564 percent of outlays. Under the Administration's budget, development aid would equal 0.556 percent of outlays in 2002.
5. U.S. Overseas Loans and Grants: and Assistance from International Organizations (Statistical Annex I to the Annual Development Coordination Committee Report to Congress), Office of Budget in the Bureau of Management of the U.S. Agency for International Development. The data in this publication are not always provided for each individual year. For example, the 1946-48 figures are lumped together into one number.
6. Based on the U.S. AID data, U.S. "Economic Assistance" (the category AID uses that is somewhat analogous to the definition of development aid this paper uses) averaged 1.75 percent of GDP from 1946 to 1948. From 1949 to 1952, it averaged 1.53 percent of GDP, while from 1953 to 1961, it averaged 0.60 percent of GDP. Over the 1962-1993 period, it averaged 0.27 percent of GDP. In 1997, the latest year the U.S. AID data cover, Economic Assistance equaled 0.11 percent of GDP.
Switching to the data cited in this paper that cover recent years and are based on data from OMB, discretionary spending on development aid equaled 0.12 percent of GDP in 1997. Under the Administration's budget, development aid would equal 0.10 percent of GDP in 2002.
The same pattern applies when development aid is measured as a percentage of all federal outlays. According to the U.S. AID data, Economic Assistance averaged 10.45 percent of all federal outlays from 1946 to 1948. From 1949 to 1952, it averaged 9.58 percent of outlays and from 1953 to 1961, it averaged 3.31 percent of outlays. Over the 1962-1993 period, it averaged 1.26 percent of outlays. In 1997, Economic Assistance equaled 0.57 percent of outlays. Switching to the OMB data, discretionary spending on development aid equaled 0.61 percent of outlays in 1997. Under the Administration's budget, development aid would equal 0.56 percent of outlays in 2002.
7. The Role of Foreign Aid in Development, Eric J. Labs, Congressional Budget Office, May 1997.
8. Mandatory spending in these areas consists primarily of inflows of funds into credit liquidating accounts. This cash flow is a result of loans made before 1992, when the Credit Reform Act went into effect; it does not affect the current level of credit assistance. Under the Bush budget, in 2002 the net figure for mandatory spending on development aid would be minus $1.4 billion (i.e., there will be an in-flow of $1.4 billion). If the figures for discretionary and mandatory spending are combined, spending on foreign development aid is lower than the figures cited in this paper — expenditures in 2002 are estimated to be $9.5 billion, rather than the $10.9 billion figure used here. This is because the $10.9 billion in discretionary spending will be offset by $1.4 billion in mandatory receipts, for a net combined level of $9.5 billion. In combination, discretionary and mandatory development aid spending will remain relatively constant in inflation-adjusted terms from 2001 to 2006 but will fall to a post-World War II low as a share of the economy.
9. The 1994 elections led to a change in the party that controls the U.S. Congress, from Democrats to Republicans. The new majority was less supportive of development aid.
10. According to data from OMB, in 1962, the earliest year for which these data are available, development aid equaled 0.58 percent of the economy, about five times its current level. These figures are not strictly comparable, however, because of the difference in the treatment of loans before and after 1992. See Appendix 2 for a discussion of this issue.
11. The other countries on the Committee are Australia, Austria, Belgium, Denmark, Finland, Greece, Ireland, Italy, Luxembourg, Netherlands, New Zealand, Norway, Portugal, Spain, Sweden, and Switzerland.
12. Specifically, the OECD's measure of ODA consists of "Grants or loans to countries and territories on Part 1 of the DAC List of Aid Recipients (developing countries) which are: undertaken by the official sector; with promotion of economic development and welfare as the main objective; at concessional financial terms (if a loan, having a GRANT ELEMENT of at least 25 per cent)." This definition does not encompass grants, loans, or credits for military purposes.
13. Development Co-operation, 2000 Report, OECD, 2001.
14. A very small part of this percentage decline reflects the addition of new donor countries to the list for which OECD compiles data. For example, in the 1978-1979 period, the OECD did not examine contributions from Greece, Luxembourg, Portugal, or Spain. These countries are included in the 1998-99 data. These countries account for only a tiny fraction of ODA. Had these countries not been included in the OECD list in recent years, the U.S. share of total ODA would have been 17.1 percent in 1998-1999, as compared to 16.5 percent when these countries are included.
15. The U.S. "Gross National Product" (used by OECD) and the U.S. "Gross Domestic Product" (used earlier in this paper and in most U.S. data) are very similar.
16. The OECD also tracks "Official Aid." This includes the same types of economic aid as ODA, but differs from ODA in that the countries receiving this aid are considered better off than the countries receiving ODA. The amount of Official Aid extended world-wide is much lower than the amount of ODA provided. Partly because U.S. economic aid is less well-targeted on poor countries than the aid that other industrialized nations provide, the United States ranks slightly above average in the amount of Official Aid it provides, measured as a share of the economy.
When Official Assistance and ODA are combined, however, the United States continues to compare unfavorably. In 1998-1999, approximately 0.13 percent of U.S. GNP went to Official Aid and ODA combined. This was the lowest share of any of the 22 countries. In fact, it was well below half of the average share of GNP that the other countries contributed in Official Aid and ODA combined.
17. World Development Report 1999/2000: Attacking Poverty, The World Bank, September 2000 and Poverty Trends and Voices of the Poor, The World Bank Group, December 2, 1999.
18. The number of people in developing and transitional countries living on less than $1 a day was about the same in 1998 as it had been in 1987. The share of the population with such income levels did decline, from 28 percent of the population of such countries in 1987 to 24 percent in 1998.
19. Human Development Report 2000, United Nations Development Program, 2000.
20. Indeed, it is more likely than not that the data for the 1980s understates the level of development aid during that period. This is because the repayment of loans granted before 1980 are counted as an in-flow of funds according to the data, thereby diminishing the overall level of spending recorded.

Search | Publication Library | Job Opportunities | Internship Information

To join the Center's e-mail notification list, ask questions,
or send comments, write to [email protected]
Center on Budget and Policy Priorities
820 First Street, NE, Suite 510
Washington, DC 20002
Ph: (202) 408-1080
Fax: (202) 408-1056