
SOCIAL SECURITY LIFTS 1 MILLION CHILDREN ABOVE THE POVERTY LINE
by Arloc Sherman
| PDF of full report |
| If you cannot access the files through the links, right-click on the underlined text, click "Save Link As," download to your directory, and open the document in Adobe Acrobat Reader. |
A little-known aspect of the Social Security program is its powerful role in providing income security for children. Census Bureau data show that 5.3 million children lived in families that received income from Social Security in 2002. Many of these children qualified themselves for Social Security payments because they were the survivor or dependent of a deceased, disabled, or retired worker who qualified for Social Security. Other children do not receive payments themselves but live in families where someone receives Social Security.
An analysis of Census data shows that:
-
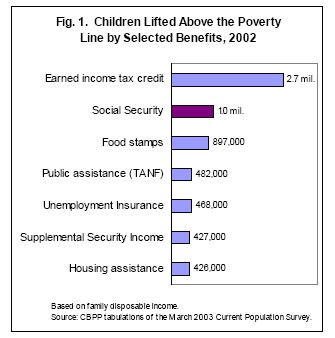
Nationwide, Social Security benefits lifted one million children under 18 above the poverty line in 2002.
-
Apart from the earned income tax credit, no other government program lifts more children above the poverty line. (See Figure 1.)
-
Social Security reduced the number of children whose families had disposable incomes below the poverty line in 2002 from 10.3 million (when Social Security is not counted) to 9.3 million (when Social Security is counted), a reduction of one-tenth.
-
In half of the states, Social Security lifts more than 10,000 children our of poverty. These state data cover the period 2000-2002.
(Disposable income means income after taxes and counting any government income assistance, food stamps, school lunch, housing benefits, or energy assistance.)
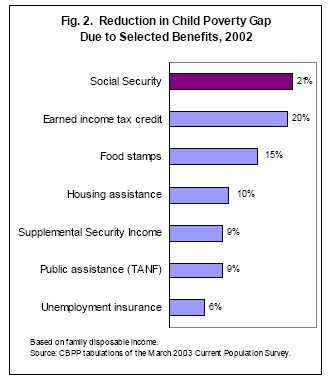
Moreover, when both the breadth and severity of children’s poverty are considered, Social Security does more to reduce child poverty than any other program, including the earned income tax credit. One combined measure of the breadth and severity of children’s poverty is the aggregate child poverty gap: the cumulative dollar amount by which the incomes of all poor families with children fall short of the poverty line. Social Security reduced the child poverty gap by 21 percent in 2002 — slightly more than the reduction achieved by the EITC (20 percent) or food stamps (15 percent).
Poverty status in this analysis is determined by comparing the family’s disposable income with the official federal poverty line, which was $18,810 for a family of four in 2003.[1]
To calculate the anti-poverty effects of Social Security, we determined each family’s poverty status twice, first excluding and then including the family’s Social Security benefits, and examined the resulting reduction in poverty.[2] We used data from the Census Bureau’s annual Current Population Survey, the same data source used in the government’s official poverty statistics.
State-by-State Findings
Table 1 shows the number of children lifted above the poverty line by Social Security in each state. To improve the reliability of the state-by-state data, the state figures reflect a three-year average for the period from 2000 through 2002. The state data indicate:
- In 25 states, Social Security lifted more than 10,000 children above the poverty line.
- In California alone, 141,000 children were lifted above the poverty line by Social Security.
- In Texas, Social Security lifted 81,000 children above the poverty line.
- In Mississippi, Social Security lowered the child poverty rate by 3.8 percentage points, from 22.3 percent when Social Security income is not counted to 18.5 percent when Social Security is counted. This was the largest percentage-point reduction of any state.
Table 1 also shows the margin of error, or statistical uncertainty, surrounding the estimates due to the limited size of the survey sample on which the data are based. For example, in California, Social Security lifted 141,000 children above the poverty line, plus or minus 22,500 children.
Who Are the Children Who Benefit From Social Security?
Children may be helped by Social Security both directly, by receiving payments themselves, and indirectly, by living in the family of a Social Security beneficiary.
Social Security records show that 3.1 million children under 18 qualified for Social Security payments themselves in December 2003 because they were the survivor or dependent of a deceased, disabled, or retired worker who qualified for Social Security.[3]
- Some 1.3 million children under 18 received Social Security payments because they were the survivor of a deceased worker.
- Another 1.5 million children received payments because their parent had a severe disability.
- Finally, 273,000 children under 18 received payments because their parent or grandparent-caregiver was retired. Certain children may qualify as dependents of their grandparent when their own parents are deceased or disabled.
(For figures on the number of child Social Security beneficiaries by state, see Table 2.)
The majority of children receiving Social Security had family members who also received Social Security, either as the qualifying worker or as a spouse or dependent of that worker. Social Security thus had a combined effect on these families’ resources larger than the child’s payments alone.
In addition to the children who receive Social Security payments themselves, a substantial number of children receive no payments but still benefit from the program because a member of their family receives Social Security. For example, in an extended family where a child lives with an aunt who received Social Security, the child does not qualify as the aunt’s dependent but still benefits from the higher family income due to the aunt’s Social Security payments. In total, 5.3 million children lived in families that received income from Social Security in 2002, according to Census Bureau data.
|
Percentage of children in families with income below the poverty line |
||||
|
Children lifted above poverty line by Social Security |
Margin of Error |
Excluding Social Security |
Including Social Security |
|
| U.S. Total |
984,000 |
± 46,000 |
14.2% |
12.9% |
|
Alabama |
26,000 |
± 7,100 |
16.9 |
14.6 |
|
Alaska |
2,000 |
± 800 |
9.2 |
8.0 |
|
Arizona |
17,000 |
± 6,800 |
17.4 |
16.2 |
|
Arkansas |
10,000 |
± 3,600 |
24.4 |
23.0 |
|
California |
141,000 |
± 22,500 |
15.3 |
13.9 |
|
Colorado |
7,000 |
± 3,200 |
10.6 |
10.0 |
|
Connecticut |
8,000 |
± 3,000 |
8.8 |
7.9 |
|
Delaware |
2,000 |
± 900 |
9.3 |
8.2 |
|
District of Columbia |
2,000 |
± 800 |
25.4 |
23.5 |
|
Florida |
50,000 |
± 11,200 |
15.6 |
14.3 |
|
Georgia |
23,000 |
± 9,100 |
15.5 |
14.4 |
|
Hawaii |
3,000 |
± 1,300 |
10.7 |
9.7 |
|
Idaho |
4,000 |
± 1,700 |
14.0 |
12.9 |
|
Illinois |
49,000 |
± 10,800 |
14.9 |
13.4 |
|
Indiana |
18,000 |
± 5,900 |
10.6 |
9.4 |
|
Iowa |
2,000 |
± 1,600 |
8.0 |
7.7 |
|
Kansas |
4,000 |
± 1,900 |
10.6 |
10.1 |
|
Kentucky |
17,000 |
± 5,200 |
15.9 |
14.2 |
|
Louisiana |
29,000 |
± 7,900 |
21.4 |
19.0 |
|
Maine |
3,000 |
± 1,200 |
12.4 |
11.1 |
|
Maryland |
8,000 |
± 4,000 |
6.8 |
6.2 |
| Massachusetts |
22,000 |
± 6,500 |
11.1 |
9.6 |
|
Michigan |
34,000 |
± 8,500 |
13.0 |
11.6 |
|
Minnesota |
4,000 |
± 2,700 |
5.5 |
5.2 |
|
Mississippi |
29,000 |
± 6,600 |
22.3 |
18.5 |
|
Missouri |
18,000 |
± 6,100 |
11.6 |
10.3 |
|
Montana |
6,000 |
± 1,800 |
17.6 |
14.8 |
|
Nebraska |
4,000 |
± 1,700 |
10.8 |
9.9 |
|
Nevada |
8,000 |
± 2,500 |
10.0 |
8.6 |
|
New Hampshire |
2,000 |
± 1,000 |
5.4 |
4.6 |
|
New Jersey |
22,000 |
± 6,600 |
8.5 |
7.3 |
|
New Mexico |
10,000 |
± 3,400 |
21.2 |
19.2 |
|
New York |
65,000 |
± 12,000 |
16.8 |
15.3 |
|
North Carolina |
34,000 |
± 8,800 |
16.3 |
14.6 |
|
North Dakota |
2,000 |
± 600 |
13.4 |
12.3 |
|
Ohio |
38,000 |
± 9,600 |
12.8 |
11.4 |
|
Oklahoma |
14,000 |
± 4,500 |
17.9 |
16.4 |
|
Oregon |
8,000 |
± 3,500 |
12.3 |
11.3 |
|
Pennsylvania |
36,000 |
± 8,700 |
11.9 |
10.6 |
|
Rhode Island |
3,000 |
± 1,000 |
10.8 |
9.6 |
|
South Carolina |
25,000 |
± 6,200 |
17.2 |
14.8 |
|
South Dakota |
3,000 |
± 800 |
9.9 |
8.6 |
|
Tennessee |
25,000 |
± 8,400 |
17.3 |
15.5 |
|
Texas |
81,000 |
± 16,400 |
18.7 |
17.3 |
|
Utah |
9,000 |
± 2,900 |
10.3 |
9.1 |
|
Vermont |
2,000 |
± 700 |
10.7 |
9.1 |
|
Virginia |
16,000 |
± 6,600 |
9.2 |
8.3 |
|
Washington |
15,000 |
± 6,100 |
10.8 |
9.8 |
|
West Virginia |
8,000 |
± 2,300 |
19.9 |
17.7 |
|
Wisconsin |
14,000 |
± 5,100 |
10.1 |
9.0 |
|
Wyoming |
2,000 |
± 700 |
10.7 |
8.7 |
|
|
|
|
|
U.S. Total |
47,053,000 |
3,081,500 |
|
Alabama |
870,000 |
74,300 |
|
Alaska |
61,000 |
7,500 |
|
Arizona |
859,000 |
56,200 |
|
Arkansas |
537,000 |
41,500 |
|
California |
4,359,000 |
279,800 |
|
Colorado |
559,000 |
35,500 |
|
Connecticut |
583,000 |
31,700 |
|
Delaware |
145,000 |
9,400 |
|
District of Columbia |
72,000 |
4,700 |
|
Florida |
3,333,000 |
192,500 |
|
Georgia |
1,170,000 |
97,700 |
|
Hawaii |
195,000 |
11,100 |
|
Idaho |
212,000 |
13,600 |
|
Illinois |
1,873,000 |
117,600 |
|
Indiana |
1,026,000 |
65,400 |
|
Iowa |
544,000 |
24,800 |
|
Kansas |
444,000 |
25,500 |
|
Kentucky |
769,000 |
61,300 |
|
Louisiana |
731,000 |
67,300 |
|
Maine |
263,000 |
17,000 |
|
Maryland |
753,000 |
52,200 |
|
Massachusetts |
1,064,000 |
63,300 |
|
Michigan |
1,694,000 |
112,500 |
|
Minnesota |
765,000 |
37,200 |
|
Mississippi |
537,000 |
56,400 |
|
Missouri |
1,034,000 |
72,000 |
|
Montana |
164,000 |
10,100 |
|
Nebraska |
288,000 |
15,600 |
|
Nevada |
330,000 |
21,700 |
|
New Hampshire |
214,000 |
14,500 |
|
New Jersey |
1,366,000 |
78,100 |
|
New Mexico |
296,000 |
24,000 |
|
New York |
3,033,000 |
188,300 |
|
North Carolina |
1,436,000 |
100,800 |
|
North Dakota |
114,000 |
4,600 |
|
Ohio |
1,937,000 |
106,300 |
|
Oklahoma |
615,000 |
40,500 |
|
Oregon |
598,000 |
30,900 |
|
Pennsylvania |
2,388,000 |
124,800 |
|
Rhode Island |
192,000 |
10,800 |
|
South Carolina |
733,000 |
57,400 |
|
South Dakota |
139,000 |
7,800 |
|
Tennessee |
1,048,000 |
78,600 |
|
Texas |
2,794,000 |
209,000 |
|
Utah |
257,000 |
20,200 |
|
Vermont |
109,000 |
6,900 |
|
Virginia |
1,092,000 |
73,700 |
|
Washington |
891,000 |
48,200 |
|
West Virginia |
403,000 |
26,800 |
|
Wisconsin |
924,000 |
45,400 |
|
Wyoming |
81,000 |
5,200 |
Technical Note
In determining poverty status, we looked at family disposable income (that is, after-tax cash income plus food, housing, and energy benefits). This approach results in lower estimates of poverty than the official Census Bureau poverty data, which rely on pre-tax income and leave out non-cash benefits.
Our calculations are similar to the experimental poverty measures used by many other analysts, including the U.S. Census Bureau’s measure 14a at www.census.gov/hhes/poverty/poverty02/r&dtable5.html (“Percent of People in Poverty, by Definition of Income and Selected Characteristics: 2002 (Revised)”). The approach used here differs in two ways from the Census Bureau’s experimental measure 14a. Our approach does not include capital gains and losses (due to the absence of reliable state data) but counts the value of low-income home energy assistance. As a result of these differences, the poverty rate among all U.S. children in 2002 was 12.8 percent under our approach, compared with 12.1 percent under Census definition 14a.[4] Under the government’s official definition of poverty, the child poverty rate in 2002 was 16.7 percent.
It should be noted that while there is widespread agreement that the official (cash) poverty measure is flawed, considerable uncertainty remains over the best way to measure poverty. There are questions about the methods used under experimental measure 14a to estimate the value of certain non-cash benefits. There also is controversy over whether the measure of income should be adjusted to include non-cash benefits without adjusting the poverty threshold itself. The methods used here reflect the limitations of the available data.
End Notes:
[1] This approach to measuring income is more comprehensive than that used in the official measure of poverty because it accounts for more sources of income and thereby results in fewer families being counted as poor. It is similar to the approach used by other analysts, including the U.S. Census Bureau in its experimental poverty estimates. (See technical note at the end of this analysis.)
[2] This approach does not take into account any changes in behavior that might occur in the absence of Social Security. If Social Security did not exist, some families might work somewhat more. Because recipient families by definition have a disabled, deceased, or retired worker, however, their ability to work more is often limited.
[3] Annual Statistical Supplement, 2004, Social Security Administration, Table 5.a1.4, www.ssa.gov/policy/docs/statcomps/supplement/2004/5a.html#table5.a1.4. The figures described above are limited to children under age 18. They do not include another 128,000 beneficiaries classified by the Social Security Administration as “children” who qualified for Social Security because they were age 18 or 19 and still completing high school. Nor do they include another 757,000 “disabled adult children” who received Social Security payments; this group is made up of grown children, age 18 or older who qualify as Social Security “child” beneficiaries, despite their age, because of their disability.
[4] These are national estimates for 2002. To provide reliable state-by-state estimates, Table 1 shows data for a three-year average of 2000 through 2002. During that period, an average of 12.9 percent of children nationwide had disposable family income below the poverty line.