
PASSING DOWN THE DEFICIT:
FEDERAL POLICIES CONTRIBUTE TO THE SEVERITY OF THE STATE FISCAL CRISIS
By Iris J. Lav and
Andrew Brecher
|
This
Full Report: HTM |
PDF Press Release: HTM | PDF Fact Sheet: HTM | PDF Related Report: |
|
| If you cannot access the files through the links, right-click on the underlined text, click "Save Link As," download to your directory, and open the document in Adobe Acrobat Reader. |
Executive Summary
The state fiscal crisis has been deep and
prolonged. States have struggled to close deficits that have totaled
approximately $190 billion over the past three years. And, as states
debate and enact budgets for fiscal year 2005 (which, in most states,
begins on
Federal policies, which have reduced state revenues and imposed additional costs on states, have played a significant role in enlarging these deficits and are impeding states’ fiscal recovery. These federal policies have contributed significantly to the need for states and localities to make expenditure cuts and enact tax increases to bring their budgets into balance.
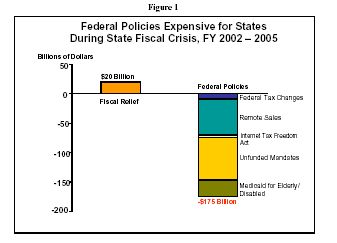
- Federal policies have cost states and localities more than $175 billion over the four-year course of the state fiscal crisis, from state fiscal year 2002 through fiscal year 2005.
- These costs have averaged 8.4 percent of total state general fund budgets during that time, a large amount.
- The federal government provided $20 billion in federal fiscal relief to the states in 2003. This $20 billion helped states avoid some budget cuts and tax increases, but it pales in comparison to the magnitude of the state fiscal crisis and to the more than $175 billion in state costs and forgone revenues over the 2002-2005 period that are attributable to federal policies. (See Figure 1.)
In seven states, the net cost of these federal
policies — the total cost less the offsetting fiscal relief — exceeds $5
billion over the course of the fiscal crisis. The states with the largest
net losses from federal policies are
The net loss relative to the size of state
budgets varies substantially by state, from a low of 1.4 percent of the
general fund budget in
-
The states bearing the greatest relative cost of federal
policies tend to be among the least affluent states in the country, as
measured by per capita income and poverty rate. Arkansas, Louisiana,
Mississippi, Oklahoma, and
- Eight of the 10 poorest states — Arkansas, Mississippi, West Virginia, Louisiana, Alabama, Oklahoma, South Carolina, and Arizona — are among the 20 states with the most severe losses resulting from federal policies.
-
States that have a relatively heavy reliance on federal
funding for their budgets also are among those that have been hardest hit.
Of the 11 states with the greatest losses as a share of their budgets, six
—
-
States that are most reliant on raising revenues through a
sales tax are another group that is bearing a high cost of federal
policies. Among the 11 states with the greatest loss from federal policies
relative to their budgets,
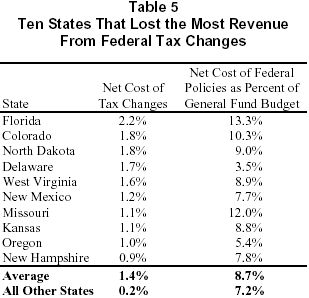
- Finally, five of the 11 states with the greatest relative loss from federal policies have lost a significant amount of revenue as a result of the federal tax changes of the past three years. Florida, Missouri, Louisiana, Colorado, and Oklahoma all fall into this category due to their failure to decouple their tax codes from these federal changes.
At least five areas of federal policies have contributed to these monetary losses and to the fiscal distress of the states: federal tax policy, federal preemption of state and local taxing authority, the failure of Congress to address Supreme Court rulings that prevent states and localities from collecting taxes owed to them, mandates that require states to spend funds for particular purposes, and federal Medicare and Medicaid policies that have become expensive for states.
- Some of the federal tax cuts enacted in 2001, 2002 and 2003 are reducing state revenues because of linkages between the federal and state tax codes. While some states have “decoupled” their tax systems from some of these federal tax cuts, others have not. The states that have not decoupled are losing approximately $9 billion during the four-year course of the fiscal crisis.
- Federal policies bar states from imposing normal state taxes on certain types of transactions. One example is the federal Internet Tax Freedom Act, first enacted in 1998, which bars states from placing taxes on the access fees that people pay for their Internet service. Just this one preemption of state taxing authority is costing states over $4 billion during the fiscal crisis.
- Two Supreme Court cases prevent state and local governments from collecting sales taxes on most items that their residents buy through catalogs or over the Internet, even though sales taxes apply when the very same items are purchased in retail stores. The Supreme Court noted that Congress has the authority to enact legislation that enables states that elect to do so to exercise their normal authority to impose sales tax on such purchases. Although federal legislation has been introduced to correct this problem, it has not garnered significant support from Congress or the Administration, and its passage is not expected anytime soon. Research suggests that state and local governments are losing at least $61 billion during the fiscal crisis as a result of the federal government’s lack of action to resolve this problem.
- The federal government has placed an assortment of demands and requirements on state and local governments without adequately funding them. These so-called unfunded mandates or underfunded obligations include requirements in the areas of election reform, education of disabled children, and the No Child Left Behind law. Total funding for these programs is $73 billion below promised funding levels.
- Finally, there is the failure of the federal government to cover the cost of prescription medications for low-income elderly and disabled individuals who are eligible for both Medicare, which is a federal program, and Medicaid, a program for which states bear an average of 43 percent of the costs. For all other services covered by both Medicare and Medicaid, Medicare is the primary payer. Nevertheless, the federal government for many years failed to act to cover prescription drugs under Medicare — despite enormous shifts in medical practice in recent decades that have made drug therapies central to the provision of health care.
This has been a particular problem for states during the fiscal crisis, during which time the cost to Medicaid of providing prescription drugs to the population eligible for both Medicare and Medicaid has been rising at double-digit rates each year. As a result, states (and the few localities that contribute to Medicaid) are spending about $28 billion in state and local funds during the course of the fiscal crisis to provide prescription drugs to low-income elderly and disabled beneficiaries who are eligible for both Medicare and Medicaid.[1]
In addition to the negative impact of specific federal policies, there is the question of whether the federal government has taken sufficient action to alleviate the severity of the state fiscal crisis. The federal government is the only level of government that can — and arguably should — run temporary deficits during an economic downturn. It makes sense for the federal government to use this power to run temporary deficits to stimulate the economy when it is weak, and to do so by — along with other steps — providing sufficient temporary fiscal assistance to states to avert some of the more severe types of measures that states have had to institute in the past few years to balance their budgets. Congress did provide $20 billion in fiscal relief to states in 2003, and that relief has proved important to states, but it pales in comparison to the size of the problem. Even after taking fiscal relief into account, the cost to states of federal policy has averaged 7.4 percent of total state general fund budgets since the fiscal crisis began.
If the federal deficit were not mounting at an alarming rate in part because of costly tax cuts heavily geared toward high-income households, the federal government could afford to do more to help states avert substantial cuts in education and health care and significant state tax increases. Such actions by states have constituted a drag on a weak economy and also can have decidedly negative human consequences.
| Total Costs | % of budget | Net costs | % of budget | |
| Florida | 12,177 | 14.4% | 11,229 | 13.3% |
| Nevada | 1,207 | 13.8% | 1,102 | 12.6% |
| Missouri | 3,721 | 13.4% | 3,345 | 12.0% |
| Mississippi | 1,835 | 13.2% | 1,625 | 11.7% |
| Louisiana | 3,058 | 11.6% | 2,749 | 10.4% |
| Arkansas | 1,634 | 11.6% | 1,458 | 10.4% |
| Colorado | 2,568 | 11.4% | 2,329 | 10.3% |
| South Carolina | 2,300 | 11.4% | 2,044 | 10.1% |
| Texas | 13,345 | 11.2% | 12,067 | 10.1% |
| Oklahoma | 2,122 | 11.2% | 1,904 | 10.0% |
| South Dakota | 433 | 12.0% | 361 | 10.0% |
| Wyoming | 353 | 12.1% | 286 | 9.8% |
| Alabama | 2,391 | 10.7% | 2,126 | 9.5% |
| Vermont | 413 | 11.6% | 330 | 9.2% |
| Tennessee | 3,426 | 10.4% | 3,003 | 9.1% |
| North Dakota | 390 | 11.0% | 318 | 9.0% |
| West Virginia | 1,190 | 9.9% | 1,065 | 8.9% |
| Kansas | 1,693 | 9.6% | 1,539 | 8.8% |
| Arizona | 2,569 | 9.9% | 2,224 | 8.6% |
| Nebraska | 955 | 9.0% | 847 | 8.0% |
| Kentucky | 2,546 | 8.8% | 2,270 | 7.9% |
| New Hampshire | 480 | 9.5% | 396 | 7.8% |
| New York | 14,827 | 9.1% | 12,663 | 7.8% |
| New Mexico | 1,433 | 8.5% | 1,297 | 7.7% |
| Washington | 3,810 | 8.3% | 3,409 | 7.4% |
| Georgia | 4,997 | 8.1% | 4,479 | 7.3% |
| Utah | 1,148 | 7.9% | 1,031 | 7.0% |
| Michigan | 6,200 | 7.7% | 5,545 | 6.9% |
| California | 23,426 | 7.6% | 20,987 | 6.8% |
| Illinois | 6,890 | 7.5% | 6,120 | 6.7% |
| North Carolina | 4,416 | 7.6% | 3,864 | 6.7% |
| Idaho | 599 | 7.5% | 514 | 6.4% |
| Indiana | 3,093 | 7.2% | 2,718 | 6.3% |
| Pennsylvania | 6,228 | 7.3% | 5,328 | 6.3% |
| Maine | 764 | 7.3% | 649 | 6.2% |
| Virginia | 3,290 | 6.6% | 2,875 | 5.8% |
| Iowa | 1,222 | 6.6% | 1,037 | 5.6% |
| Ohio | 5,767 | 6.2% | 4,996 | 5.4% |
| Oregon | 1,284 | 6.5% | 1,068 | 5.4% |
| Wisconsin | 2,738 | 6.1% | 2,385 | 5.3% |
| Maryland | 2,539 | 5.9% | 2,206 | 5.2% |
| Rhode Island | 665 | 6.0% | 564 | 5.1% |
| Hawaii | 849 | 5.5% | 768 | 5.0% |
| Minnesota | 3,048 | 5.6% | 2,686 | 4.9% |
| Montana | 323 | 6.2% | 250 | 4.8% |
| New Jersey | 4,720 | 5.0% | 4,159 | 4.4% |
| Connecticut | 2,352 | 4.8% | 2,102 | 4.2% |
| Delaware | 441 | 4.3% | 367 | 3.5% |
| Massachusetts | 3,780 | 4.1% | 3,231 | 3.5% |
| DC | 597 | 3.9% | 504 | 3.3% |
| Alaska | 206 | 2.2% | 129 | 1.4% |
| Territories and Unallocated Funds | 3,019 | N/A | 3,008 | N/A |
| U.S. | 175,479 | 8.4% | 155,386 | 7.4% |
|
Total costs exclude federal fiscal relief funds; net costs include these funds. |
||||
Analysis by the
The federal government could play a more positive role in alleviating the pain caused by the state fiscal crisis. If the federal government does not change its policies, the low- and middle-income families that are subject to the state tax increases and service cuts will, in essence, be paying for the very generous federal tax cuts for the highest-income Americans.
Federal Policies
There are a number of ways in which federal policies have made the state fiscal crisis deeper and more prolonged. These include specific federal policies that have: a) reduced state revenue directly; b) prevented states from raising revenue; c) reduced funding for programs that states and localities operate; and d) imposed new costs on states. Although the $20 billion in federal fiscal relief has certainly helped to avert some severe budget cuts, particularly in Medicaid, the federal government could have helped states avert more of the damaging budget cuts and regressive tax increases they have been forced to institute.
Federal Policies Reduce State Revenue
A number of provisions in the three
federal tax cuts enacted in 2001, 2002, and 2003 have reduced state as well
as federal revenues, because state tax systems are tied to the federal tax
code in a number of ways. One such federal tax cut is the phase-out over
four years (2002 – 2005) of the federal estate tax credit that reduces the
federal estate tax by a dollar for each dollar paid in state estate
taxes. Every state in the nation levied a state estate tax that was tied
to this federal credit, with most states’ laws simply setting their own
estate tax at a level equal to the federal tax credit; as a result, the
change in federal tax law that is eliminating the federal credit
effectively eliminates state estate taxes in most states. Some 17 states
and the
Another federal tax cut that is causing states to lose state revenue is a business tax cut known as “bonus depreciation.” As originally enacted in 2002, the federal “bonus depreciation” tax cut allowed businesses to deduct immediately 30 percent of the cost of equipment they purchase, rather than writing off the cost of the equipment in a more even manner over the equipment’s useful life (i.e., over a number of years). Most states tie their depreciation tax rules to the federal depreciation rules. As a result, they would have experienced a revenue loss totaling approximately $14 billion over the period from 2002 through September 2004 (the period over which the federal depreciation tax cut was initially slated to be in effect). The majority of states, however, were reluctant to piggyback on this temporary federal tax cut during a period when state revenues were declining, and 34 states have “decoupled” and maintained their prior tax treatment of depreciation rather than adopting the new, very generous federal provision.
In 2003, Congress and the Administration made the federal depreciation tax cut even more generous, allowing firms to deduct immediately 50 percent of the cost of equipment they purchase and extending this tax cut through December 2004. This is resulting in further state revenue losses in those states that have not decoupled from this federal tax cut. The non-decoupled states are losing approximately $4 billion through fiscal year 2005.
Federal policies also have prevented states from raising revenues in certain areas. The Internet Tax Freedom Act has barred states from collecting taxes on Internet access fees. These access fees are the monthly charges that Internet users pay to companies such as AOL for their Internet accounts.
This ban is costing states more than $4 billion over the four years of the state fiscal crisis from state fiscal year 2002 through 2005.[3] Furthermore, legislation that the House of Representatives passed at the end of 2003, and that is pending conference with the Senate version of the ban, would expand the types of Internet-related services that states are barred from taxing — thereby reducing state revenues to a much greater extent. The Multistate Tax Commission, a joint agency of state governments, estimates that the recently passed House legislation could cost states and localities an additional $4 billion to $8.75 billion per year by 2006.
A larger example is the failure of the federal government to empower states to collect sales taxes on items purchased over the Internet and through catalogs. When a person buys a product in a state, he or she pays sales tax at the time of purchase. If the person buys the same item over the Internet or from a catalog, however, the state generally cannot compel the out-of-state seller to collect and remit the sales tax to the state. This is because two Supreme Court decisions have barred states from requiring sales taxes to be remitted when the vendor does not have a physical presence in the state. This hurts small businesses and in-state retailers, which become less competitive with Internet and catalogue sellers, and also prevents states and localities from collecting significant amounts of revenue that otherwise would be due to them.
One of the Supreme Court decisions, the 1992 Quill decision, made clear that Congress can pass legislation to empower states to tax sales made to state residents by vendors not physically present in the state. Legislation has been introduced to this end in almost every session of Congress, but it has consistently been blocked by a coalition of federal legislators, whether out of general anti-tax ideology or in response to strong pressure from the politically potent direct marketing and electronic commerce industries.
In the past, an argument against federal action to enable states to collect sales tax on catalog and Internet sales has been that as a result of differences among state sales tax systems, a requirement to collect and remit sales tax would impose too great a burden on the out-of-state vendors. In the last few years, however, states have made substantial progress under their “Streamlined Sales Tax Project” in harmonizing state sales tax systems in ways that will substantially reduce the burden of collecting these sales taxes. The time thus is ripe for Congress to enact a solution to this problem and thereby to stem the hemorrhage of state and local revenues. So far, Congress shows no sign of doing so.
Donald Bruce and William Fox of the University of Tennessee estimate that inability to collect tax on Internet purchases last year cost states about $15 billion to $16 billion in lost revenue. During the fiscal year 2002 through 2005 period — i.e., during the state fiscal crisis — the estimated revenue loss is roughly $64 billion to $71 billion, depending on exactly how fast the E-commerce sector is growing over this period. It is unclear how much of this amount could actually have been collected by the states under a politically feasible solution to this problem. At a minimum, states would have to provide some compensation to vendors for collecting the tax, and there would have to be some exemptions from the requirement of collecting the tax to protect small vendors. A reasonable estimate is that the failure of the federal government to resolve this problem is costing states at least $61 billion over the four-year course of the state fiscal crisis.[4]
Beyond the Internet Tax Freedom Act and the E-commerce problem, there are many other examples of federal preemption of state taxing authority, although the other examples tend to be harder to quantify.[5]
Over time, the federal government has placed an assortment of demands and requirements on state and local governments without providing adequate funding. Many of these unfunded mandates, or underfunded obligations, are difficult to quantify, such as new responsibilities of state and local governments in the realm of homeland security. (See the box below.) For illustrative purposes, we focus on three areas: the education of disabled children, the Leave No Child Behind law, and new election reform requirements.
- The Individuals with Disabilities Education Act (IDEA), enacted in 1975, was most recently amended in 1997. It guarantees each disabled child an assessment and an individualized education plan. When the law was enacted, the federal government promised it would fund 40 percent of the additional costs that the law requires states to incur. Federal funding to meet this goal has fallen short by close to $40 billion over four years.[6]
- The No Child Left Behind Act requires schools to take a variety of specific steps with respect to the educational testing of children. The federal government, however, has not provided the promised level of support. During the four years of the state fiscal crisis, funding has been approximately $32 billion below the levels authorized in the Act. Moreover, this is a conservative estimate, because it is unclear how much it will cost states and localities to meet all of the new mandates in this law. For example, the law prescribes various remedies for schools in which test scores do not meet standards, including giving children the right to transfer to another school, even if providing that alternative would be costly.
- The Help America Vote Act was intended to provide federal guidelines — and resources — for local precincts to update their voting technologies. Although the federal government has made a substantial commitment to fund new election equipment in 2004, minimal funding is expected in 2005, despite the slim likelihood that all problems will be resolved by then. Overall, the funding shortfall is about $1 billion over four years.
In the past, the federal government has often placed mandates on states and localities without providing adequate funding to meet those mandates. Recently, the confluence of the state fiscal crisis and both new and old mandates has made it more difficult for state and local governments to meet these requirements. New federal requirements related to the No Child Left Behind Act are growing in cost now, at a time when states have few resources to cover such new costs. The new costs are on top of the ongoing costs of special education for children with disabilities, for which the federal government has never met its promise to pay 40 percent of the tab.
|
Homeland Security Ever since the tragedy of September 11, 2001, states and localities have become subject to a host of new mandates intended to improve preparedness, strengthen food and agriculture security, upgrade communications between agencies, and safeguard the water supply. To help meet the additional costs, the federal government has increased some grants to states and localities and created new grant programs. To this date, there has been no comprehensive study of the new homeland security initiatives undertaken by state and local governments relative to the federal aid they have received. Some estimates indicate that substantial new federal aid would be needed to meet national goals in several homeland security areas, such as telecommunications, water systems, and airport security. However, there is no consensus regarding the appropriate division of responsibility among federal, state, and local governments for providing funding for the desired upgrades. In the absence of data assessing each state’s specific homeland security needs, we have excluded homeland security costs from this analysis. |
The National Conference of State Legislatures recently estimated that unfunded mandates are costing states $29 billion in the current year.[7] This report considers a narrower set of mandates and finds the four-year cost, during the state fiscal crisis, to be approximately $73 billion.
Rising State Medicaid Costs: The Federal Role
Another issue is Medicaid. Much has been made of the rate of growth of Medicaid costs, which reflects, in large part, the rapid growth of health care costs in the economy generally. However, a portion of the growth in state Medicaid costs is due to another factor: a gradual shift in the cost of caring for low-income elderly and disabled people from the federal government to the states.
Over the last several years, an increasing share of the cost of health care for low-income elderly and disabled people who are enrolled in both Medicare and Medicaid has been shifting from Medicare, a federal program, to Medicaid, a program in which states bear an average of 43 percent of the costs. This has occurred in part because the duration of hospital stays has decreased, with greater reliance being placed on outpatient services and pharmaceuticals to manage health conditions. For beneficiaries covered by both Medicare and Medicaid — also known as “dual eligibles” — the Medicare program is the primary payer for hospital stays. By contrast, Medicare currently does not generally cover outpatient prescription drugs; only Medicaid does. (Medicaid also is the only payer for long-term care.)
As a result, when changes in the provision of health care lead to shorter hospital stays and greater reliance on outpatient pharmaceutical therapies, costs shift from the federal Medicare program to the federal/state Medicaid program, and hence from the federal government to the states. This shift is quite significant, since at least 35 percent of all Medicaid expenditures are made on behalf of low-income elderly and disabled individuals who are enrolled in both Medicare and Medicaid. The cost to states for outpatient prescription drugs for this population is approximately $28 billion over the four-year fiscal crisis period.
The recently enacted Medicare drug bill will leave states responsible for the large majority of these drug costs even in years after 2005, when the new Medicare prescription drug benefit takes effect. Under the drug bill, seniors and disabled individuals eligible for both Medicare and Medicaid will receive drug coverage through Medicare beginning in 2006. But, while this will produce significant savings for state Medicaid programs, states will be required to return the bulk of these savings to the federal government in perpetuity.[8] Moreover, states face new, unreimbursed costs of $1.2 billion over the next three years for implementing the new Medicare law.
Impact on State Budgets Is Large and Growing
The federal policies discussed above are costing states more than $175 billion over the four-year period of the state fiscal crisis, from state fiscal year 2002 through 2005. Over these four years, these costs to states are growing from $34 billion in 2002 to an estimated $55 billion in 2005. Two areas have particularly contributed to the rise in cost: the growth in Internet sales, and the increase in the cost of prescription drug spending for seniors and disabled individuals who are eligible for both Medicare and Medicaid. Internet sales are estimated to more than double from 2002 to 2005, while the cost of prescription drugs is expected to grow by about three-fifths.
With state general fund expenditures declining in real terms over the course of the state fiscal crisis, these federal policies have put an increasing squeeze on state governments. When measured against state budgets, these costs have been significant. Federal policies are costing an amount equal to 8.4 percent of total state general fund expenditures, or 7.4 percent if the offsetting federal fiscal relief funds are considered.[9
The costs of federal policies during the fiscal crisis equal or exceed five percent of general fund budgets in 46 states. In 16 of these states, the costs equal or exceed ten percent of general fund budgets. Even if the offsetting fiscal relief is included, net costs still equal or exceed five percent of general fund budgets in 43 states and equal or exceed ten percent in eleven states. (See Table 1.)
-
Total costs as a percentage of state budgets vary from a high
of 14.4 percent in
-
When the fiscal relief is factored in, the net costs vary
from a high of 13.3 percent in
Impact Varies by State Characteristics
The states that are particularly hard hit by the federal policies described above include the poorest states and states that tend to be more reliant on federal funds for funding programs. In addition, states in which federal policies have been particularly costly include those with tax systems that are particularly dependent on sales taxes, and those that have lost significant revenues because of recent federal tax actions.
The Poorest States
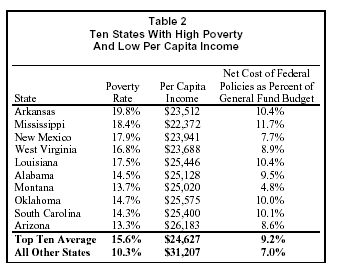
The poorest states — those in which the population has the greatest need for a variety of government services and those with the least ability to raise their own funds to pay for those services — are among those most affected by the federal policies discussed in this report. Table 2 shows the ten states that are top-ranked on both of two measures of relative poverty: having a high overall poverty rate and having low per capita income.[10] Eight of the 10 poorest states — Arkansas, Mississippi, West Virginia, Louisiana, Alabama, Oklahoma, South Carolina, and Arizona — are among the 20 states with the most severe losses resulting from federal policies.
In the ten states with the highest rates of poverty and lowest per capita incomes, the net cost of the federal policies described here averages 9.2 percent of their state general fund budgets, as compared to an average of seven percent of budgets for all other states.[11]
The disparate impact of recent federal policies on high-poverty states appears to result from several factors. The underfunding of No Child Left Behind and IDEA disproportionately affects poorer states, because those programs include poverty weights in their distribution formulas and also represent a higher share of these states’ overall spending. In addition, a high prevalence of elderly poor contributes to increased costs in providing prescription drugs under Medicaid.
States With Higher Reliance on Federal Funds
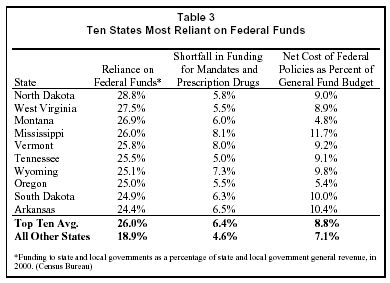
The states that are most dependent on federal funding appear to be disproportionately affected by the failure to adequately fund mandates and prescription drug costs. There is significant variability in the degree to which states are reliant on federal funding. According to the Census Bureau, federal aid on average provides about 20 percent of total state and local government general revenue. The 10 states with the highest reliance, however, each derive more than 24 percent of their state and local government general revenue from the federal government.
As Table 3 indicates, the ten states with the heaviest reliance on federal dollars have faced a cost from these and other federal policies that averages 8.8 percent of their state budgets, compared to an average cost of 7.1 percent for all other states. Eight of the 10 states most reliant on federal funds are among the 20 states that are experiencing the most negative impacts from the federal policies.
A number of factors affect the degree of reliance on federal funds. They include the size and the wealth of the state (factors often embedded in federal grant formulas) and the amount of revenue the state itself raises through its tax system. According to Census Bureau data, public assistance programs (primarily Medicaid) and education programs are the two largest sources of federal aid; each of the ten states that are most reliant on federal funds are among the ten states that receive the most funding in at least one of these program categories, as a share of state and local general revenue.
Sales Tax Reliant States
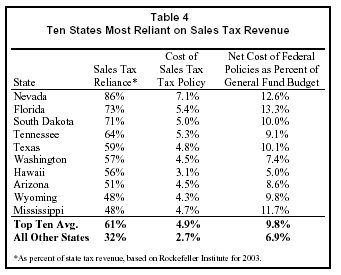
Federal policy has significantly restricted the ability of states to raise revenue through their sales taxes. Both the failure to solve the problem of how to collect taxes on sales made over the Internet and through catalogs, and the barring of taxation of Internet access fees, affect state and local sales tax revenues. States that rely heavily on their sales tax to raise revenue are more affected by these federal restrictions than those with a more diverse revenue base. The inability of states and localities to collect sales taxes on remote sales is the largest single cost to states imposed by federal policy, accounting for $1 for every $3 in total costs considered in this report.
Sales tax reliance is especially
heavy in the seven states that have a sales tax but no broad personal
income tax:
Table 4 shows the ten states that are most reliant on sales tax revenue. For these ten, the net cost of federal policies has averaged 9.8 percent of their budgets, as contrasted with an average of 6.9 percent for all other states.
Other states with large revenue losses due to
federal sales tax restrictions include
By contrast, the five states with no sales tax
—
States with Tax Losses Related to Federal Policies
Most states have lost revenue due to the manner
in which their state tax codes are tied to federal law. The revenue loss
from the 2001, 2002, and 2003 federal tax law changes cost nine states an
amount equal to or greater than one percent of their budgets. These states
are
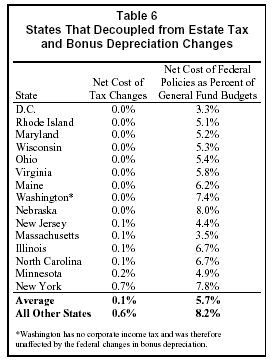
In response to the federal tax cuts, many states “decoupled” elements of their tax code to minimize the degree that state revenue would be affected.[13]
A large majority of the potential revenue loss stems from the estate tax and the bonus depreciation provisions. In addition to the District of Columbia, fourteen states — Illinois, Maine, Maryland, Massachusetts, Minnesota, Nebraska, New Jersey, New York, North Carolina, Ohio, Rhode Island, Virginia, Washington, and Wisconsin — have decoupled from both of the two large revenue-losing provisions. These decoupled states have faced a net cost of federal policies well below the national average, amounting to an average of 5.7 percent of their general fund budgets. (See Table 6.)
The Fiscal Crisis
The costs stemming from these federal policies have added to the other forces creating the state fiscal crisis, including the economic slowdown, the stock market decline, and the lack of job growth during the recovery. Federal policies have contributed substantially to the depth of the state fiscal crisis and are impeding the ability of states to recover their fiscal health.
States began to fall into fiscal crisis in state fiscal year 2002. Over the past three years — 2002 to 2004 — states have closed combined deficits of about $190 billion. States now face additional deficits of approximately $40 billion for state fiscal year 2005.
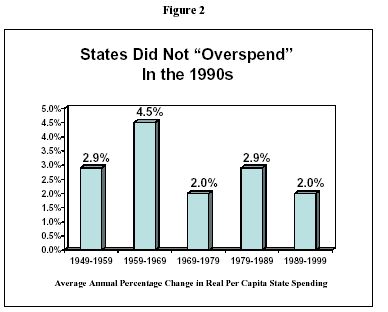
These deficits have not, as some assert, stemmed primarily from a state spending spree in the 1990s. State spending growth in the 1990s (adjusted for inflation and population changes), was low by historical standards; it was lower than or equal to spending growth in every other decade since World War II. (See Figure 2.) Furthermore, most of the growth in state spending that did occur during the 1990s was in education, health care, and corrections — areas where costs were rising, need was growing, and/or voters were demanding improvements. Nine out of ten new state dollars (adjusted for inflation) went into these three areas.[14]
Nor did states fail to prepare for the downturn. States built up their rainy day funds during the 1990s, raising total reserves to their highest level in 20 years. By the end of fiscal year 2000, states had total year-end balances (including both general-fund balances and rainy-day funds) of almost $50 billion, or 10.4 percent of expenditures. Prior to the recession of the early 1990s, states had total balances of only $12.5 billion, or 4.8 percent of expenditures. As a result, states were better prepared for this economic downturn than they were for the recession of the early 1990s. But those reserves have largely been depleted as a result of the unusually large state revenue declines of the past few years.
State revenues, adjusted for inflation and policy changes, declined for eight consecutive quarters during this fiscal crisis. Total state tax collections for the 12 months ending in June 2003 (the period that corresponds to fiscal year 2003 in most states) were about $21.6 billion less, in nominal terms, than for the 12-month period ending in June 2001, according to the U.S. Census Bureau. When adjusted to compensate for inflation and population growth, revenues in this 12-month period were $56.9 billion lower than in 2001. State taxes made up a smaller share of the economy in the last fiscal year than at any time in the previous thirty years, with the exception of the double-dip recession of the early 1980s. Revenues have begun to grow again in fiscal year 2004, but growth is not yet strong.[15]
States dealt with the revenue decline in large part by cutting their budgets. Total state spending in fiscal year 2004 is about $73 billion less than it would have been if real per-capita spending during 2001-2004 had continued to grow at the same rate it did during the 1990s. (During the 1990s, real per-capita spending grew about 2 percent annually, a lower rate than in previous decades.) Real per-capita spending will be 5.4 percent lower in fiscal year 2004 than in 2001. Total state spending as a share of GDP is projected to be the lowest in over fifteen years.[16] This has been achieved through cuts in a range of programs.
Some 34 states have cut eligibility for public
health insurance, primarily through cuts in Medicaid and/or the State
Children’s Health Insurance Program. Between 1.2 million and 1.6 million
people are losing coverage, about half of whom are children. Most of these
cuts involved measures to scale back health care coverage for children and
parents in families in which the parents work at low-wage jobs. For
example, cutbacks in
In addition, at least 32 states
have cut eligibility for child care subsidies targeted on low- and
moderate-income families or otherwise limited such families’ access to
child care. In 20 states, child care assistance is no longer available to
low-income working families newly applying for such help; such families go
on waiting lists instead.[17]
At the end of last year, for example, 48,000 children were on the child
care waiting list in
Although states usually show great reluctance to cut K-12 education, a substantial number of states have instituted cuts. Per-pupil K-12 education spending, adjusted for inflation, dropped in 34 states between 2002 and 2004.[18] This has resulted in the imposition of new or higher fees for textbooks and courses, shorter school days, reduced personnel, reduced transportation, and a variety of other types of cutbacks. States throughout the country also are cutting higher education — leading to double-digit increases in public college and university tuition and significantly reduced course offerings. The tuition increases are creating barriers to higher education for a number of low- and moderate-income families.
In addition to these cuts enacted over the past three years, further budget cuts have been proposed for fiscal year 2005. At least five states have proposed additional reductions in eligibility for health care programs. Thirteen states are developing budgets that will cut funding for K-12 education and related programs below the level needed to maintain current services, and ten are expected to cut higher education funding and/or require significant increases in tuition and fees at public colleges and universities. Eight states have proposed measures that would restrict eligibility for child care programs for the upcoming year.
Federal Policies Could Help
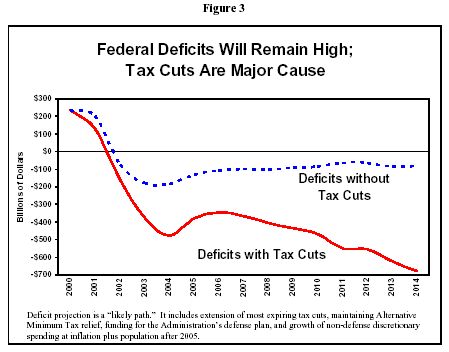
As federal budgets are written for the next several years, many programs are likely to be squeezed. The federal tax cuts enacted in the past three years have added substantially to the federal budget deficit. (The tax cuts will cost $275 billion in 2004 alone, of which $85 billion will go to the one percent of Americans with the highest incomes.) So have increases in defense spending, the decline in the economy, and other factors. The deficit is now expected to be $477 billion in fiscal year 2004, according to the Congressional Budget Office. If the tax cuts are extended and other anticipated policies (including reform to the Alternative Minimum Tax) are implemented, federal deficits are expected to remain above $340 billion every year in the coming decade and to total approximately $4.6 trillion over the decade.[19] (See Figure 3.)
These high budget deficits increasingly will constrain the ability of the federal government to fund other priorities, including grants-in-aid to states. The Administration has proposed reducing the total buying power of federal grants to states and localities for purposes other than Medicaid — including grants for education, transportation, environmental protection, and other program areas — by 3.5 percent, or approximately $6 billion, in fiscal year 2005. This would hamper the ability of states and localities to recover from the fiscal crisis.
While the $20 billion in federal fiscal relief that was enacted in mid-2003 has been very helpful in averting some damaging state budget cuts, this amount falls far short of the relief that the federal government could — and should — be providing to states during the current period of economic sluggishness and state fiscal crisis. Most states are required to balance their operating budgets even in economic downturns. The budget cuts and tax increases they enact during such times pull money out of the economy, thereby slowing the economy even more and causing a loss of jobs.
Only the federal government can remedy this problem. It need not balance its budget in a recession; it can run deficits. (Running large persistent federal budget deficits when the economy is healthy can ultimately harm the economy, but running deficits during economic slumps is helpful. It puts more money into the economy and stimulates it.) It therefore makes sense for the federal government to provide significant fiscal relief to states when the economy is weak. Even though the economy has begun to recover, state fiscal conditions remain weak. There is still need for federal assistance.
It also makes sense for the federal government to assist states to a greater degree with the cost of providing health care to lower-income elderly and disabled people and thereby to cushion the fiscal effects of the recent changes in health care practice that have shifted costs from the federal government to the states. And it makes sense for the federal government to fund more adequately the mandates it imposes on state and local governments and to resolve the problems associated with federal preemption of state tax bases. With the exception of the preemption issues, addressing these matters would require federal funds.
There thus is a choice for federal policymakers. It is a choice between maintaining in full the extremely generous federal tax cuts for high-income households and moderating those tax cuts and instituting more equitable policies toward states that help state and local governments to preserve important endeavors in areas such as health care, child care, and education — areas on which low- and middle-income state residents rely — and avert regressive tax and fee increases. At bottom, this is a question of which course represents the higher priority for the nation.
| Federal Tax Changes | Internet Sales |
Internet Access Tax |
Special Education | No Child Left Behind | Election Reform | Prescription Drugs | Total Costs | Fiscal Relief |
Net |
|
| Alabama | 90 | 814 | 57 | 625 | 500 | 10 | 295 | 2,391 | -266 | 2,126 |
| Alaska | 8 | 0 | 0 | 111 | 32 | 3 | 51 | 206 | -76 | 129 |
| Arizona | 115 | 1,069 | 91 | 608 | 515 | 11 | 160 | 2,569 | -346 | 2,224 |
| Arkansas | 33 | 658 | 34 | 391 | 309 | 6 | 203 | 1,634 | -176 | 1,458 |
| California | 2,253 | 8,018 | 822 | 4,050 | 4,237 | 73 | 3,973 | 23,426 | -2,439 | 20,987 |
| Colorado | 408 | 922 | 67 | 497 | 315 | 9 | 348 | 2,568 | -239 | 2,329 |
| Connecticut | 198 | 874 | 63 | 460 | 259 | 8 | 490 | 2,352 | -250 | 2,102 |
| DC | 0 | 167 | 8 | 67 | 309 | 3 | 44 | 597 | -94 | 504 |
| Delaware | 176 | 0 | 0 | 106 | 97 | 3 | 59 | 441 | -75 | 367 |
| Florida | 1,826 | 4,304 | 248 | 2,290 | 1,444 | 37 | 2,028 | 12,177 | -948 | 11,229 |
| Georgia | 192 | 2,030 | 134 | 1,081 | 932 | 18 | 610 | 4,997 | -518 | 4,479 |
| Hawaii | 57 | 483 | 0 | 151 | 84 | 3 | 69 | 849 | -80 | 768 |
| Idaho | 22 | 204 | 21 | 184 | 125 | 3 | 40 | 599 | -85 | 514 |
| Illinois | 69 | 2,429 | 209 | 1,850 | 1,268 | 27 | 1,038 | 6,890 | -770 | 6,120 |
| Indiana | 56 | 984 | 84 | 978 | 414 | 13 | 564 | 3,093 | -375 | 2,718 |
| Iowa | -200 | 506 | 38 | 452 | 192 | 7 | 227 | 1,222 | -185 | 1,037 |
| Kansas | 198 | 612 | 42 | 385 | 239 | 6 | 212 | 1,693 | -154 | 1,539 |
| Kentucky | 82 | 724 | 44 | 593 | 474 | 9 | 620 | 2,546 | -276 | 2,270 |
| Louisiana | -28 | 1,370 | 69 | 617 | 647 | 10 | 373 | 3,058 | -309 | 2,749 |
| Maine | 0 | 197 | 20 | 223 | 149 | 3 | 172 | 764 | -115 | 649 |
| Maryland | 0 | 893 | 70 | 698 | 417 | 12 | 450 | 2,539 | -333 | 2,206 |
| Massachusetts | 55 | 920 | 100 | 1,012 | 682 | 14 | 998 | 3,780 | -549 | 3,231 |
| Michigan | 474 | 2,293 | 145 | 1,379 | 1,088 | 22 | 798 | 6,200 | -655 | 5,545 |
| Minnesota | 115 | 1,240 | 77 | 686 | 344 | 11 | 575 | 3,048 | -362 | 2,686 |
| Mississippi | 53 | 624 | 37 | 391 | 416 | 6 | 308 | 1,835 | -211 | 1,625 |
| Missouri | 320 | 1,194 | 83 | 858 | 469 | 12 | 784 | 3,721 | -376 | 3,345 |
| Montana | 10 | 0 | 0 | 120 | 145 | 3 | 45 | 323 | -73 | 250 |
| Nebraska | 0 | 323 | 26 | 267 | 173 | 4 | 163 | 955 | -109 | 847 |
| Nevada | 71 | 588 | 36 | 241 | 187 | 4 | 81 | 1,207 | -105 | 1,102 |
| New Hampshire | 45 | 0 | 0 | 185 | 118 | 3 | 129 | 480 | -84 | 396 |
| New Jersey | 54 | 1,549 | 130 | 1,385 | 648 | 19 | 936 | 4,720 | -561 | 4,159 |
| New Mexico | 195 | 592 | 0 | 326 | 251 | 4 | 65 | 1,433 | -136 | 1,297 |
| New York | 1,068 | 4,815 | 363 | 2,771 | 2,937 | 42 | 2,831 | 14,827 | -2,164 | 12,663 |
| North Carolina | 49 | 1,354 | 113 | 1,120 | 746 | 18 | 1,015 | 4,416 | -552 | 3,864 |
| North Dakota | 63 | 119 | 0 | 86 | 73 | 3 | 45 | 390 | -71 | 318 |
| Ohio | 0 | 2,034 | 175 | 1,494 | 1,034 | 25 | 1,005 | 5,767 | -771 | 4,996 |
| Oklahoma | -16 | 915 | 61 | 537 | 439 | 8 | 179 | 2,122 | -218 | 1,904 |
| Oregon | 191 | 0 | 0 | 462 | 308 | 8 | 315 | 1,284 | -217 | 1,068 |
| Pennsylvania | 139 | 2,034 | 197 | 1,509 | 1,094 | 28 | 1,227 | 6,228 | -900 | 5,328 |
| Rhode Island | 0 | 168 | 23 | 192 | 133 | 3 | 146 | 665 | -102 | 564 |
| South Carolina | 118 | 705 | 52 | 669 | 452 | 9 | 294 | 2,300 | -255 | 2,044 |
| South Dakota | 25 | 180 | 0 | 106 | 69 | 3 | 50 | 433 | -72 | 361 |
| Tennessee | 38 | 1,668 | 88 | 786 | 476 | 13 | 357 | 3,426 | -424 | 3,003 |
| Texas | 508 | 5,328 | 375 | 3,075 | 2,670 | 44 | 1,345 | 13,345 | -1,278 | 12,067 |
| Utah | 70 | 482 | 37 | 340 | 135 | 4 | 80 | 1,148 | -117 | 1,031 |
| Vermont | 18 | 96 | 11 | 94 | 86 | 3 | 104 | 413 | -83 | 330 |
| Virginia | 0 | 1,097 | 84 | 1,047 | 458 | 16 | 588 | 3,290 | -415 | 2,875 |
| Washington | 0 | 1,916 | 132 | 746 | 408 | 13 | 594 | 3,810 | -401 | 3,409 |
| West Virginia | 187 | 317 | 20 | 315 | 253 | 4 | 94 | 1,190 | -125 | 1,065 |
| Wisconsin | 0 | 975 | 0 | 784 | 404 | 12 | 564 | 2,738 | -352 | 2,385 |
| Wyoming | 16 | 117 | 7 | 83 | 97 | 3 | 30 | 353 | -67 | 286 |
| Territories and Unallocated Funds | 512 | 2,505 | 3 | 3,019 | -11 | 3,008 | ||||
| TOTAL | 9,421 | 60,900 | 4,491 | 39,994 | 32,257 | 639 | 27,777 | 175,479 | -20,092 | 155,386 |
| Federal Tax | Internet | Internet | Special | No Child | Election | Prescription | Total | Fiscal | Net | |
| Changes | Sales | Access | Education | Left Behind | Reform | Drugs | Costs | Relief | Costs | |
| Florida | 2.20% | 5.10% | 0.30% | 2.70% | 1.70% | 0.00% | 2.40% | 14.40% | -1.10% | 13.30% |
| Nevada | 0.80% | 6.70% | 0.40% | 2.80% | 2.10% | 0.10% | 0.90% | 13.80% | -1.20% | 12.60% |
| Missouri | 1.10% | 4.30% | 0.30% | 3.10% | 1.70% | 0.00% | 2.80% | 13.40% | -1.40% | 12.00% |
| Mississippi | 0.40% | 4.50% | 0.30% | 2.80% | 3.00% | 0.00% | 2.20% | 13.20% | -1.50% | 11.70% |
| Louisiana | -0.10% | 5.20% | 0.30% | 2.30% | 2.50% | 0.00% | 1.40% | 11.60% | -1.20% | 10.40% |
| Arkansas | 0.20% | 4.70% | 0.20% | 2.80% | 2.20% | 0.00% | 1.40% | 11.60% | -1.30% | 10.40% |
| Colorado | 1.80% | 4.10% | 0.30% | 2.20% | 1.40% | 0.00% | 1.50% | 11.40% | -1.10% | 10.30% |
| South Carolina | 0.60% | 3.50% | 0.30% | 3.30% | 2.20% | 0.00% | 1.50% | 11.40% | -1.30% | 10.10% |
| Texas | 0.40% | 4.50% | 0.30% | 2.60% | 2.20% | 0.00% | 1.10% | 11.20% | -1.10% | 10.10% |
| Oklahoma | -0.10% | 4.80% | 0.30% | 2.80% | 2.30% | 0.00% | 0.90% | 11.20% | -1.10% | 10.00% |
| South Dakota | 0.70% | 5.00% | 0.00% | 2.90% | 1.90% | 0.10% | 1.40% | 12.00% | -2.00% | 10.00% |
| Wyoming | 0.50% | 4.00% | 0.20% | 2.80% | 3.30% | 0.10% | 1.00% | 12.10% | -2.30% | 9.80% |
| Alabama | 0.40% | 3.70% | 0.30% | 2.80% | 2.20% | 0.00% | 1.30% | 10.70% | -1.20% | 9.50% |
| Vermont | 0.50% | 2.70% | 0.30% | 2.60% | 2.40% | 0.10% | 2.90% | 11.60% | -2.30% | 9.20% |
| Tennessee | 0.10% | 5.10% | 0.30% | 2.40% | 1.40% | 0.00% | 1.10% | 10.40% | -1.30% | 9.10% |
| North Dakota | 1.80% | 3.40% | 0.00% | 2.40% | 2.10% | 0.10% | 1.30% | 11.00% | -2.00% | 9.00% |
| West Virginia | 1.60% | 2.60% | 0.20% | 2.60% | 2.10% | 0.00% | 0.80% | 9.90% | -1.00% | 8.90% |
| Kansas | 1.10% | 3.50% | 0.20% | 2.20% | 1.40% | 0.00% | 1.20% | 9.60% | -0.90% | 8.80% |
| Arizona | 0.40% | 4.10% | 0.30% | 2.30% | 2.00% | 0.00% | 0.60% | 9.90% | -1.30% | 8.60% |
| Nebraska | 0.00% | 3.10% | 0.20% | 2.50% | 1.60% | 0.00% | 1.50% | 9.00% | -1.00% | 8.00% |
| Kentucky | 0.30% | 2.50% | 0.20% | 2.10% | 1.60% | 0.00% | 2.20% | 8.80% | -1.00% | 7.90% |
| New Hampshire | 0.90% | 0.00% | 0.00% | 3.70% | 2.30% | 0.10% | 2.50% | 9.50% | -1.70% | 7.80% |
| New York | 0.70% | 2.90% | 0.20% | 1.70% | 1.80% | 0.00% | 1.70% | 9.10% | -1.30% | 7.80% |
| New Mexico | 1.20% | 3.50% | 0.00% | 1.90% | 1.50% | 0.00% | 0.40% | 8.50% | -0.80% | 7.70% |
| Washington | 0.00% | 4.20% | 0.30% | 1.60% | 0.90% | 0.00% | 1.30% | 8.30% | -0.90% | 7.40% |
| Georgia | 0.30% | 3.30% | 0.20% | 1.80% | 1.50% | 0.00% | 1.00% | 8.10% | -0.80% | 7.30% |
| Utah | 0.50% | 3.30% | 0.30% | 2.30% | 0.90% | 0.00% | 0.60% | 7.90% | -0.80% | 7.00% |
| Michigan | 0.60% | 2.90% | 0.20% | 1.70% | 1.40% | 0.00% | 1.00% | 7.70% | -0.80% | 6.90% |
| California | 0.70% | 2.60% | 0.30% | 1.30% | 1.40% | 0.00% | 1.30% | 7.60% | -0.80% | 6.80% |
| Illinois | 0.10% | 2.70% | 0.20% | 2.00% | 1.40% | 0.00% | 1.10% | 7.50% | -0.80% | 6.70% |
| North Carolina | 0.10% | 2.30% | 0.20% | 1.90% | 1.30% | 0.00% | 1.80% | 7.60% | -1.00% | 6.70% |
| Idaho | 0.30% | 2.60% | 0.30% | 2.30% | 1.60% | 0.00% | 0.50% | 7.50% | -1.10% | 6.40% |
| Indiana | 0.10% | 2.30% | 0.20% | 2.30% | 1.00% | 0.00% | 1.30% | 7.20% | -0.90% | 6.30% |
| Pennsylvania | 0.20% | 2.40% | 0.20% | 1.80% | 1.30% | 0.00% | 1.40% | 7.30% | -1.10% | 6.30% |
| Maine | 0.00% | 1.90% | 0.20% | 2.10% | 1.40% | 0.00% | 1.70% | 7.30% | -1.10% | 6.20% |
| Virginia | 0.00% | 2.20% | 0.20% | 2.10% | 0.90% | 0.00% | 1.20% | 6.60% | -0.80% | 5.80% |
| Iowa | -1.10% | 2.80% | 0.20% | 2.50% | 1.00% | 0.00% | 1.20% | 6.60% | -1.00% | 5.60% |
| Ohio | 0.00% | 2.20% | 0.20% | 1.60% | 1.10% | 0.00% | 1.10% | 6.20% | -0.80% | 5.40% |
| Oregon | 1.00% | 0.00% | 0.00% | 2.30% | 1.60% | 0.00% | 1.60% | 6.50% | -1.10% | 5.40% |
| Wisconsin | 0.00% | 2.20% | 0.00% | 1.80% | 0.90% | 0.00% | 1.30% | 6.10% | -0.80% | 5.30% |
| Maryland | 0.00% | 2.10% | 0.20% | 1.60% | 1.00% | 0.00% | 1.10% | 5.90% | -0.80% | 5.20% |
| Rhode Island | 0.00% | 1.50% | 0.20% | 1.70% | 1.20% | 0.00% | 1.30% | 6.00% | -0.90% | 5.10% |
| Hawaii | 0.40% | 3.10% | 0.00% | 1.00% | 0.50% | 0.00% | 0.50% | 5.50% | -0.50% | 5.00% |
| Minnesota | 0.20% | 2.30% | 0.10% | 1.30% | 0.60% | 0.00% | 1.10% | 5.60% | -0.70% | 4.90% |
| Montana | 0.20% | 0.00% | 0.00% | 2.30% | 2.80% | 0.10% | 0.90% | 6.20% | -1.40% | 4.80% |
| New Jersey | 0.10% | 1.60% | 0.10% | 1.50% | 0.70% | 0.00% | 1.00% | 5.00% | -0.60% | 4.40% |
| Connecticut | 0.40% | 1.80% | 0.10% | 0.90% | 0.50% | 0.00% | 1.00% | 4.80% | -0.50% | 4.20% |
| Delaware | 1.70% | 0.00% | 0.00% | 1.00% | 0.90% | 0.00% | 0.60% | 4.30% | -0.70% | 3.50% |
| Massachusetts | 0.10% | 1.00% | 0.10% | 1.10% | 0.70% | 0.00% | 1.10% | 4.10% | -0.60% | 3.50% |
| DC | 0.00% | 1.10% | 0.10% | 0.40% | 2.00% | 0.00% | 0.30% | 3.90% | -0.60% | 3.30% |
| Alaska | 0.10% | 0.00% | 0.00% | 1.20% | 0.30% | 0.00% | 0.50% | 2.20% | -0.80% | 1.40% |
| TOTAL | 0.50% | 2.90% | 0.20% | 1.90% | 1.50% | 0.00% | 1.30% | 8.40% | -1.00% | 7.40% |
Appendix 4
Notes on Sources and
Methodology
The data for this analysis were derived from a variety of sources.
Federal Tax Changes. Wherever possible, estimates from state revenue departments or legislative fiscal offices were used. Where in-state estimates were unavailable, estimates were computed using data from a number of official sources. For the estate tax, we used actual state fiscal year 2002 collections and Congressional Budget Office projections to estimate estate tax revenue prior to the enactment of the federal tax cut. We then made adjustments based on enacted changes to the federal estate tax and the state estate tax credit, using state-by-state data from the Internal Revenue Service on estates subject to tax. For bonus depreciation, a Congressional Research Service estimate of total state revenue impact was adjusted using revenue data from the Joint Committee on Taxation and state-by-state personal income tax and corporate income tax revenue data from the Census Bureau. For Section 179 expensing, estimates were derived from Joint Committee on Taxation estimates of federal revenue loss, also using state-by-state data from the Census Bureau.[20] For states that gained revenue due to a state deduction of federal income taxes paid, estimates were obtained from the Iowa Department of Revenue, the Oregon Legislative Revenue Office, and the Institute for Taxation and Economic Policy model.
Internet Sales. Figures were based on Bruce and Fox (2001) estimates of total sales tax revenue loss from E-Commerce for 2002-2005, apportioned to the states using their state-by-state estimates for 2001 and 2006.[21]
Internet Tax Freedom Act. Internet
usage estimates were based on Jupiter Research projections of
Unfunded Mandates. For special education and the No Child Left Behind programs, state and local data were compiled by Federal Funds Information to States (FFIS), a joint service of the National Governors Association and the National Conference of State Legislatures that tracks and reports on the fiscal impact of federal budget and policy decisions on state budgets and programs, based on information from the Department of Education. Estimates for No Child Left Behind exclude programs funded by the Fund for Improvement of Education, the composition of which has changed since the law was enacted; programs that do not directly affect state and local education spending; and programs without a specifically authorized funding level. Election reform funding estimates are also compiled by FFIS, based on state allocations set out in the Help America Vote Act of 2002.
For all of these programs, some funds were
allocated to territories such as
Medicaid Dual Eligibles. Estimates of
prescription drug spending in 2002 were obtained from the Kaiser Commission
on Medicaid and the Uninsured.[24]
Estimates for 2003 to 2005 were calculated by adjusting the Kaiser
estimates for 2002, using Congressional Budget Office projections of
spending and enrollment growth from 2002 to 2005 as reflected in CBO’s
March 2003 baseline, adjusted by Census Bureau estimates of the growth of
the elderly population in each state. Data for states with large numbers
of beneficiaries enrolled in managed care, such as
To determine the current size of state general
fund budgets, we obtained the most recently available information from
publications, public officials, or other analysts in each state.
Historical data were obtained from the National Association of State Budget
Officers.[25]
For states that have not enacted a fiscal year 2005 budget, we use
governors’ proposed budgets. For some states, such as
Finally, all data were adjusted where necessary
to reflect the fiscal year for each state. Most state fiscal years run
from July to June, except for
In all tables, totals may not add due to rounding.
End Notes:
[1] It should be noted that the new Medicare law enacted in 2003 will cover under Medicare some of the cost of prescription drugs for all Medicare beneficiaries beginning in 2006. The new law includes an unprecedented provision, however, that will require states to reimburse the federal government for most of the cost of prescription drug coverage for individuals who are eligible for Medicaid as well as Medicare.
[2]
Isaac Shapiro and Joel Friedman,
Tax Returns: A Comprehensive
Assessment of the Bush Administration’s Record on Cutting Taxes,
Center on Budget and Policy Priorities,
[3] The ban expired at the end of November 2003, and as of this writing, Congress continues to debate the form in which it will be extended. Even though there is a hiatus in the ban, it is very likely to be extended, and states and localities are acting as if it is still in place.
[4] Donald Bruce and William F. Fox, State and Local Sales Tax Revenue Losses from E-Commerce: Estimates as of July 2004, University of Tennessee Center for Business and Economic Research.
[5] For example, federal law prohibits state and local governments from taxing airline and bus tickets purchased for interstate travel. Were states able to apply their sales taxes to such tickets, the revenue gain would be large. Federal law also prohibits states and localities from taxing the income of certain out-of-state corporations. P.L. 86-272 provides that neither a state nor its subdivisions can impose a corporate profits tax on an out-of-state corporation if the corporation’s only activity within the state is soliciting orders for physical goods, provided the orders are approved at an out-of-state office of the seller and the goods are shipped into the state from an out-of-state location. This allows corporations to have an unlimited number of salespeople in a state at all times, yet remain exempt from tax so long as the salespeople work out of their homes. When P.L. 86-272 was enacted in 1959, it was intended to be temporary. However, it has never been repealed, and over the years, it has shielded tremendous amounts of corporate profits from state taxation.
[6] These and other estimates of spending and shortfalls in funding mandates are derived from data compiled by Federal Funds Information to States (FFIS), a joint service of the National Governors Association and the National Conference of State Legislatures that tracks and reports on the fiscal impact of federal budget and policy decisions on state budgets and programs. For details on sources and methodology, see Appendix 4.
[7] National Conference of State
Legislatures, The Mandate Monitor,
[8] This would mark the first time states were required to finance a portion of a new Medicare benefit. Through the so-called “clawback” mechanism, the federal government would recoup a large portion of the money saved by state Medicaid programs as a result of Medicare taking over responsibility for providing drug coverage to the dual eligibles. Starting in 2006, when the new Medicare law takes effect, states would have to pay back 90 percent of such savings. This percentage would phase down to 75 percent by 2015.
[9]
[10] These ten states are each among the top thirteen states in terms of both highest poverty rates and lowest per capita incomes. States are listed in order of average rank in both categories.
[11] In this analysis, we use the arithmetic average of the cost of the federal policies in each state as a percentage of that state’s general fund budget. The results do not differ significantly when looking at a weighted average or at the median-state cost as a percentage of state general fund budgets.
[12]
Some states were “grandfathered” into the Internet Tax Freedom Act and
retain sales taxes on consumer Internet access fees that other states
are barred from imposing. These states include
[13]
Nine states — Alabama, Iowa, Louisiana, Missouri, Montana, North
Dakota, Oklahoma, Oregon, and Utah — have actually gained some revenue
as a result of the federal tax changes, because they allow taxpayers to
deduct federal incomes taxes paid; smaller federal tax bills have meant
smaller state deductions and higher state tax bills. Such revenue
gains are factored into this analysis. Only three of the states,
[14]
John Springer, Did States Spend their Way into this Fiscal Crisis?
Center on Budget and Policy Priorities,
[15] Nicholas W. Jenny, Growth Finally Stronger at End of 2003, Rockefeller Institute of Government, March 2004.
[16]
Elizabeth McNichol and Makeda Harris.
Many States Cut Budgets as
Fiscal Squeeze Continues, Center on Budget and Policy Priorities,
[17] Danielle Ewen and Katherine Hart, State Budget Cuts Create A Growing Child Care Crisis For Low-Income Working Families, Children’s Defense Fund, March 2003.
[18] Andrew Reschovsky, “The Impact of State Government Fiscal Crises on Local Governments and Schools”, State and Local Government Review, Spring 2004 (forthcoming).
[19]
Isaac Shapiro and Joel Friedman,
Tax Returns: A Comprehensive
Assessment of the Bush Administration’s Record on Cutting Taxes,
Center on Budget and Policy Priorities,
[20]
For more information on these calculations, see Elizabeth C. McNichol,
Iris J. Lav and
[21]
Donald Bruce and
[22]
Robyn Greenspan, “Broadband’s Reach Gets Broader,”
[23]
Pew Internet and American Life Project, “Internet Use by Region in the
[24] Brian Bruen and John Holahan, Shifting the Cost of Dual Eligibles: Implications for States and the Federal Government, November 2003; and Kaiser Commission on Medicaid and the Uninsured, Dual Eligibles: Enrollment and Spending, by State, 2002, February 2004.
[25] National Governors Association and National Association of State Budget Officers, “The Fiscal Survey of States”, December 2003.