| NEWS RELEASE __________ |
|
||||||||||||||||||||||||||||||||||||||||||||||||||||||||||||||||||||||||||||||||||||||||||||||||||||||||||||||||||||||||||||||||||||||||||||||||||||||||||||||||||||||||||||||||||||||||||||||||||||||||||||||||||||||||||||||||||||||||||||||||||||||||||||||||||||||||||||||||||||||
| 820 First
Street, NE Suite 510 Washington, DC 20002 Tel: 202-408-1080 Fax: 202-408-1056 [email protected] www.cbpp.org
Robert Greenstein Iris J. Lav Board of Directors
David de Ferranti, Chair John R. Kramer, Vice Chair Henry J. Aaron Ken Apfel Barbara B. Blum Marian Wright Edelman James O. Gibson Beatrix Hamburg, M.D. Frank Mankiewicz Richard P. Nathan Marion Pines Sol Price Robert D. Reischauer Audrey Rowe Susan Sechler Juan Sepulveda, Jr. William Julius Wilson |
FEDERAL POLICIES HARMING STATE BUDGETS
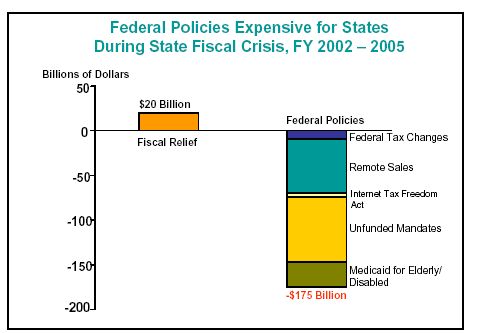
Federal policies that impose new costs on states and restrict state revenues have deepened the state fiscal crisis, a new report from the Center on Budget and Policy Priorities finds. The report is the first to provide state-by-state data on the budgetary damage these policies have caused. In all, added costs and lost revenue total $175 billion over fiscal years 2002-2005, or an average of 8.4 percent of total state general fund budgets. As a result, states and localities have been forced to impose much larger spending cuts and tax increases than otherwise would have been necessary to balance their budgets. This extra burden has fallen primarily on low- and middle-income families. Not only do many such families rely on services that are being cut (such as child care and public universities), but most of the recent state tax increases have come in regressive taxes such as sales and excise taxes. “At the same time the federal government has been passing $175 billion in costs on to states, it has enacted tax cuts that provide huge benefits to high-income families,” said Iris Lav, co-director of the Center and the report’s lead author. “In essence, low- and middle-income families are paying for the tax cuts for affluent families in the form of higher state taxes and reduced state services.” Policies Include Unfunded Mandates and Restrictions on State Taxation The report describes four types of federal policies that are harming states:
The combined cost of these policies — $175 billion over fiscal years 2002-2005 — dwarfs the $20 billion in federal fiscal relief that was enacted in 2003. Poorest States Among Those Hardest Hit Federal policies have hurt some states much more than others. (The attached table from the report lists the impact on each state.) Among the hardest hit are many of the poorest states, states that rely heavily on federal grants to fund education and other programs, and states in which sales taxes are the predominant revenue source. Extending Tax Cuts for Wealthy the Top Priority? The 2001-2003 tax cuts are scheduled to phase out over the next several years. If they are extended, as the Administration and some in Congress favor, the federal government will face large budget deficits for the foreseeable future. That would effectively prevent Washington from adopting more equitable policies toward the states. “It comes down to a choice between continuing all of the large tax cuts for high-income households and moderating those tax cuts so the federal government can fix the policies that harm state budgets,” said Lav. “At bottom, this is a question of which is the higher national priority.”
Click here to view the full report, Passing Down the Deficit: Federal Policies Contribute to the Severity of the State Fiscal Crisis. The Center on Budget and Policy Priorities is a nonprofit, nonpartisan research organization and policy institute that conducts research and analysis on a range of government policies and programs. It is supported primarily by foundation grants. |
||||||||||||||||||||||||||||||||||||||||||||||||||||||||||||||||||||||||||||||||||||||||||||||||||||||||||||||||||||||||||||||||||||||||||||||||||||||||||||||||||||||||||||||||||||||||||||||||||||||||||||||||||||||||||||||||||||||||||||||||||||||||||||||||||||||||||||||||||||||