
Funding Adjustments Under a Housing Voucher Block Grant
would
BE UNLIKELY To keep pace with program Needs
by Will Fischer and
Barbara Sard
| PDF of this report |
| If you cannot access the files through the links, right-click on the underlined text, click "Save Link As," download to your directory, and open the document in Adobe Acrobat Reader. |
The Administration’s fiscal year 2004 budget states that the Administration will submit legislation to convert the housing voucher program to a block grant to the states, with the block grant taking effect in fiscal year 2005. This change poses a number of risks to the voucher program and the low-income families it serves. One of the most important of these is the possibility that funding for the block grant would not keep pace with the needs of the program over time. If annual adjustments to block-grant funding did not fully accommodate changes in voucher costs, states would be required to impose cuts or contribute their own resources to maintain voucher assistance at its current level.
The Administration’s budget does not provide details regarding the key issue here — how voucher block-grant funding would be adjusted from year to year. For two reasons, however, there is a strong possibility that funding would erode over time.
-
First, two primary indices that could be used to adjust
block-grant funding — the Consumer Price Index and HUD’s Section 8 contract
rent annual adjustment factors — have risen far more slowly in recent years
than the fair market rents that determine how much rent a voucher can cover.
(Fair market rents are a rough, but not exact, proxy for voucher costs.) If
the voucher program had been converted to a block grant five years ago,
states would have been forced to reduce the level of voucher assistance they
provide by an average of 13 percent if funding had been adjusted
annually using the Consumer Price Index, and by an average of 8 percent
if funding had been adjusted based on the contract rent annual
adjustment factors.
- Second, the block grant would be a discretionary program with funding set in the annual appropriations process. As a result, there would be no assurance that even the potentially inadequate funding increases called for under whatever inflation adjustment index is written into the block-grant legislation would actually be appropriated. Faced with tight budget allocations, the Appropriations Committees could freeze block-grant funding in some years or increase it by less than the amount called for under the adjustment factor contained in the legislation that established the block grant. Such actions in appropriations bills are common; the Appropriations Committees virtually never receive sufficient overall funding to fund most discretionary programs at the full levels authorized for those programs. Moreover, the fact that states, rather than federal policymakers, would have to make the painful decisions on where to cut their voucher programs if funding was insufficient would make it more likely that the voucher block grant would be among the programs funded below their full authorized levels. In the past, a number of other federal block grants have experienced multi-year funding freezes or received funding increases insufficient to keep pace with inflation.
It may be noted that even funding for the politically popular HOME housing block grant has failed to keep pace with inflation since HOME was established. The amount appropriated for core HOME grants to states and localities for fiscal year 2003 is five percent below the amount provided when the HOME program was created, after adjusting for inflation using the Consumer Price Index. The erosion is larger if the adjustment for inflation is based on a housing-related index. Moreover, in each year the level of funding appropriated for HOME has been below the full authorized funding level for the program.
Inadequate Adjustment of Block Grant
Funding Would Force States to Impose Cuts or
The Administration’s budget does not indicate how funding for the proposed housing voucher block grant would be adjusted from year to year. A HUD official stated in a briefing to Congressional staff on February 3 that the authorized level of block-grant funding would be adjusted based on inflation, but provided no further details. The Administration has not provided a timetable for the release of additional information regarding funding adjustments or other aspects of the block grant.
Currently, a housing agency receives funding based on the actual cost of the vouchers it administers.[1] Those costs depend on a number of local factors, including the local “payment standard” (which sets a limit on the amount of rent a voucher can cover), the actual rent and utility costs of apartments occupied by local voucher holders, and the incomes of voucher holders. Payment standards are derived from “fair market rents” for each local area, which are determined by HUD (in most cases, fair market rents are HUD’s estimate of the amount needed to cover the rental charges for the least-expensive 40 percent of housing units in the local market), but can be raised or lowered to some degree based on decisions by local housing agencies. Rents and incomes can vary widely depending on local employment and housing-market conditions. Unless the block grant somehow continued the current cost-based funding method — and it is extremely difficult to conceive how that could be done under a block grant — the amount of funding that states would receive under the block grant would not take all of these factors into account. Funding consequently would grow at a different rate than voucher costs.
If funding growth were slower than the growth in voucher costs, as would be likely, states would not receive sufficient federal funding to maintain the current level of assistance. States could respond to this situation in three ways:
- They could reduce the number of vouchers, either through attrition or by terminating assistance to some families. The Administration’s proposal, however, indicates that under the block grant, states would not be allowed to reduce the number of families served.
- States could reduce the amount of rental assistance they provide per low-income family. This could be accomplished by shifting vouchers from poorer families to those at somewhat higher income levels. (A voucher currently covers the difference between the rent for a modestly priced apartment and 30 percent of the tenant’s income, so lower-income families receive larger average subsidies and thus are more expensive to serve.) Alternatively, states could shift rental burdens to voucher recipients by requiring them to pay more than 30 percent of income for rent or reducing the total amount of rent that a voucher could cover (and thereby making units in some areas with more job opportunities or lower crime rates less accessible to voucher families).
- States could contribute funds from state revenues to enable them to maintain the same level of assistance.
How Would Voucher Funding Be Adjusted From Year to Year?
To assess the funding implications of the voucher block-grant proposal, we examined two alternative methods for adjusting the authorized level of block-grant funding from one year to the next: the national Consumer Price Index (CPI) and the annual adjustment factors that HUD uses to adjust rent levels in the project-based Section 8 program. We compared changes in these indices over the past five years to changes in fair market rents during the same period; the changes in fair market rents provide an approximation of changes in voucher costs. (It should be noted that actual voucher costs may vary from fair market rents, since actual costs are influenced by tenant incomes, local policy decisions, and other factors not reflected in fair market rents.)
If the Administration proposes that the funding level authorized for the block grant be adjusted based on general inflation, the Administration likely will propose use of the CPI or a similar index. Alternatively, if the Administration intends to propose that the authorized funding level be adjusted based on inflation in rental housing costs, it could advocate a method similar to that now used to determine the annual adjustment factors for the project-based Section 8 program; these annual adjustment factors are based on rent and utility cost data from the Consumer Price Index for large metropolitan areas and on regional surveys that cover groups of several states for other areas. The annual adjustment factors do not take into account additional variables that are used to ensure that fair market rents are responsive to local housing markets. For example, fair market rents may be adjusted using survey data for a particular metropolitan area or county and may be increased to avoid concentration of voucher holders in a small, highly impoverished section of a metropolitan area.
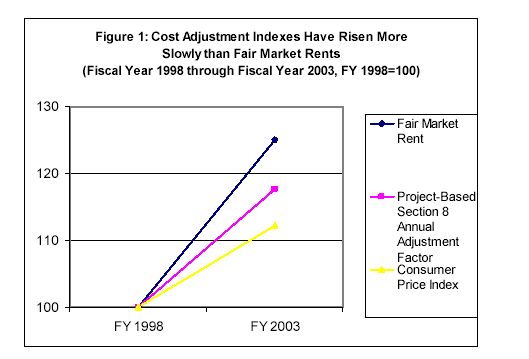
Figure 1 displays national changes in fair market rents, the Section 8 annual adjustment factors, and the Consumer Price Index over the past five years (or the most closely comparable period for which data are available). Tables 1 and 2 show the changes in these three measures over the past five years on a state-by-state basis. (The methodology used to derive these data is described in the appendix on page 10.) These data demonstrate a sharp divergence between fair market rents and these two potential cost-adjustment indices.
· Nationally, the Consumer Price Index rose by 12 percent over the five-year period, while the annual adjustment factors increased by 18 percent. By comparison, fair market rents rose 25 percent.[2]
· There were only eight states in which the Consumer Price Index kept pace with fair market rents and nine states where the annual adjustment factors kept pace with fair market rents.
·
Had the voucher program been converted to a block grant to
states five years ago, states would have been forced to reduce the level of
voucher assistance they provide by 8 percent (equivalent to 163,000
vouchers) if funding had been adjusted using the Section 8 annual adjustment
factors and by 13 percent (equivalent to 259,000 vouchers) if funding had
been adjusted based on the Consumer Price Index.
|
State |
Fair Market Rent |
Project-Based Section 8 Annual Adjustment Factor |
Change in Number of Vouchers Funded that Would Have Occurred if 1998-2003 Funding Adjustments Had Been Based on Section 8 AAF |
|
|
Percent of State Allocation |
Number of Vouchers |
|||
|
Alabama |
11.6% |
10.1% |
-2.7% |
-756 |
|
Alaska |
9.1% |
9.7% |
0.8% |
33 |
|
Arizona |
25.8% |
15.2% |
-12.7% |
-2,573 |
|
Arkansas |
11.2% |
10.3% |
-1.8% |
-394 |
|
California |
44.1% |
26.6% |
-15.9% |
-47,647 |
|
Colorado |
33.5% |
25.9% |
-8.1% |
-2,254 |
|
Connecticut |
20.1% |
15.5% |
-5.3% |
-1,782 |
|
Delaware |
13.3% |
10.9% |
-3.2% |
-146 |
|
District of Columbia |
42.1% |
17.7% |
-22.0% |
-2,223 |
|
Florida |
18.0% |
11.3% |
-8.8% |
-7,827 |
|
Georgia |
27.8% |
17.6% |
-12.3% |
-5,822 |
|
Hawaii |
-11.0% |
2.2% |
20.9% |
2,489 |
|
Idaho |
8.9% |
8.9% |
0.0% |
0 |
|
Illinois |
21.3% |
20.5% |
-0.9% |
-721 |
|
Indiana |
12.9% |
12.1% |
-1.4% |
-512 |
|
Iowa |
12.7% |
9.7% |
-5.1% |
-1,095 |
|
Kansas |
18.2% |
13.8% |
-6.8% |
-716 |
|
Kentucky |
13.6% |
10.2% |
-5.7% |
-1,783 |
|
Louisiana |
18.2% |
11.0% |
-11.6% |
-4,208 |
|
Maine |
17.0% |
11.4% |
-7.8% |
-966 |
|
Maryland |
36.2% |
17.2% |
-19.1% |
-8,052 |
|
Massachusetts |
42.6% |
25.7% |
-15.3% |
-11,074 |
|
Michigan |
18.6% |
13.6% |
-6.8% |
-3,033 |
|
Minnesota |
33.4% |
20.4% |
-14.4% |
-4,267 |
|
Mississippi |
14.2% |
9.5% |
-8.7% |
-1,489 |
|
Missouri |
27.7% |
16.6% |
-15.5% |
-6,334 |
|
Montana |
11.9% |
12.7% |
1.3% |
79 |
|
Nebraska |
15.0% |
9.7% |
-8.7% |
-998 |
|
Nevada |
19.3% |
15.1% |
-5.1% |
-588 |
|
New Hampshire |
24.0% |
22.5% |
-1.7% |
-158 |
|
New Jersey |
19.3% |
18.8% |
-0.5% |
-322 |
|
New Mexico |
12.9% |
10.3% |
-4.1% |
-555 |
|
New York |
17.5% |
17.5% |
0.0% |
-20 |
|
North Carolina |
17.7% |
10.1% |
-11.0% |
-5,957 |
|
North Dakota |
12.5% |
13.3% |
1.5% |
113 |
|
Ohio |
22.2% |
14.1% |
-11.1% |
-9,415 |
|
Oklahoma |
20.3% |
10.3% |
-16.3% |
-3,784 |
|
Oregon |
18.1% |
13.9% |
-5.7% |
-1,788 |
|
Pennsylvania |
17.6% |
12.9% |
-6.4% |
-5,112 |
|
Rhode Island |
2.8% |
10.4% |
11.7% |
1,092 |
|
South Carolina |
13.0% |
10.1% |
-4.8% |
-1,137 |
|
South Dakota |
13.6% |
12.8% |
-1.3% |
-76 |
|
Tennessee |
14.3% |
10.1% |
-6.8% |
-2,047 |
|
Texas |
20.9% |
16.7% |
-5.5% |
-7,705 |
|
Utah |
30.8% |
13.8% |
-20.5% |
-2,181 |
|
Vermont |
16.1% |
10.9% |
-6.9% |
-421 |
|
Virginia |
29.4% |
13.4% |
-18.2% |
-8,058 |
|
Washington |
21.8% |
21.3% |
-0.5% |
-221 |
|
West Virginia |
12.9% |
11.1% |
-3.7% |
-548 |
|
Wisconsin |
12.3% |
12.5% |
0.4% |
123 |
|
Wyoming |
11.7% |
12.6% |
1.4% |
37 |
|
Total |
25.0% |
17.7% |
-8.0% |
-162,800 |
The Administration could propose some different type of inflation-based adjustment that would more closely approximate changes nationally in fair market rents than the Consumer Price Index or the Section 8 annual adjustment factors do. HUD’s statement that “inflation” will be used to adjust annual block-grant funding, however, indicates that the Administration does not intend to propose maintaining the current method of basing funding on local voucher costs. Moreover, it is difficult to see how funding could continue to be based on changes in local voucher costs under a block-grant structure.
No inflation index, even if it were more sensitive than those analyzed here, would be able to accommodate all or even most of the factors that drive voucher costs — such as local rents, local changes in tenant incomes, and the need for higher payment standards to provide housing choice in particular markets — in the direct manner that the current cost-based system does. In a program where costs can change rapidly and unpredictably, the use of an incomplete cost adjustment to determine federal funding would carry significant risks to the state agencies that would administer the block grants and the low-income families they would serve.
Risks that Sufficient Funds Would Not be Appropriated to Provide the Full Amount Authorized
Whatever inflation factor the Administration proposes to use to adjust block-grant funding from year to year would be used simply to adjust the authorized level of the block grant and would not necessarily determine the amount actually appropriated. Having a program’s authorized level exceed the amount actually appropriated for it is common. Hundreds of discretionary (or non-entitlement) programs have authorized funding levels that exceed the amounts appropriated for these programs.
Table 2
Comparison of Trends in Fair Market Rents with Consumer Price Index, 1998-2003
|
State |
Fair Market Rent |
National Consumer Price Index |
Change in Number of Vouchers Funded that Would Have Occurred if 1998-2003 Funding Adjustments Had Been Based on CPI |
|
|
Percent of
State
|
Number of Vouchers |
|||
|
|
11.6% |
12.2% |
1.1% |
304 |
|
|
9.1% |
12.2% |
4.1% |
167 |
|
|
25.8% |
12.2% |
-16.3% |
-3,286 |
|
|
11.2% |
12.2% |
1.9% |
423 |
|
|
44.1% |
12.2% |
-29.0% |
-87,018 |
|
|
33.5% |
12.2% |
-22.8% |
-6,346 |
|
|
20.1% |
12.2% |
-9.1% |
-3,070 |
|
|
13.3% |
12.2% |
-1.5% |
-69 |
|
|
42.1% |
12.2% |
-26.9% |
-2,719 |
|
|
18.0% |
12.2% |
-7.6% |
-6,758 |
|
|
27.8% |
12.2% |
-18.8% |
-8,896 |
|
|
-11.0% |
12.2% |
36.6% |
4,364 |
|
|
8.9% |
12.2% |
5.9% |
381 |
|
|
21.3% |
12.2% |
-10.9% |
-9,115 |
|
|
12.9% |
12.2% |
-1.2% |
-432 |
|
|
12.7% |
12.2% |
-0.8% |
-167 |
|
|
18.2% |
12.2% |
-9.2% |
-980 |
|
|
13.6% |
12.2% |
-2.4% |
-751 |
|
|
18.2% |
12.2% |
-9.6% |
-3,486 |
|
|
17.0% |
12.2% |
-6.7% |
-830 |
|
|
36.2% |
12.2% |
-24.1% |
-10,160 |
|
|
42.6% |
12.2% |
-27.6% |
-19,937 |
|
|
18.6% |
12.2% |
-8.6% |
-3,849 |
|
|
33.4% |
12.2% |
-23.6% |
-6,993 |
|
|
14.2% |
12.2% |
-3.7% |
-637 |
|
|
27.7% |
12.2% |
-21.6% |
-8,819 |
|
|
11.9% |
12.2% |
0.5% |
27 |
|
|
15.0% |
12.2% |
-4.5% |
-520 |
|
|
19.3% |
12.2% |
-8.6% |
-1,004 |
|
|
24.0% |
12.2% |
-13.6% |
-1,249 |
|
|
19.3% |
12.2% |
-7.9% |
-5,203 |
|
|
12.9% |
12.2% |
-1.1% |
-144 |
|
|
17.5% |
12.2% |
-6.2% |
-12,347 |
|
|
17.7% |
12.2% |
-8.0% |
-4,301 |
|
|
12.5% |
12.2% |
-0.5% |
-37 |
|
|
22.2% |
12.2% |
-13.8% |
-11,663 |
|
|
20.3% |
12.2% |
-13.1% |
-3,056 |
|
|
18.1% |
12.2% |
-7.9% |
-2,486 |
|
|
17.6% |
12.2% |
-7.3% |
-5,861 |
|
|
2.8% |
12.2% |
14.4% |
1,343 |
|
|
13.0% |
12.2% |
-1.4% |
-324 |
|
|
13.6% |
12.2% |
-2.3% |
-136 |
|
|
14.3% |
12.2% |
-3.5% |
-1,038 |
|
|
20.9% |
12.2% |
-11.3% |
-15,846 |
|
|
30.8% |
12.2% |
-22.4% |
-2,388 |
|
|
16.1% |
12.2% |
-5.2% |
-318 |
|
|
29.4% |
12.2% |
-19.6% |
-8,665 |
|
|
21.8% |
12.2% |
-11.7% |
-4,729 |
|
|
12.9% |
12.2% |
-1.5% |
-217 |
|
|
12.3% |
12.2% |
-0.1% |
-23 |
|
|
11.7% |
12.2% |
0.8% |
20 |
|
Total |
25.0% |
12.2% |
-12.7% |
-258,841 |
The level authorized for a discretionary program simply sets a ceiling on the level that may be appropriated. There is no requirement that the Appropriations Committees actually appropriate such an amount. Were the Appropriations Committees to try to appropriate the full amounts authorized for most programs, the appropriations bills would breach the overall funding limits that the Appropriations Committees are assigned.
The current housing voucher program also is a discretionary program, but it is treated somewhat differently than most such programs. Because of the program’s nature and structure, HUD and the Appropriations Committees can estimate each year the amount that is needed to renew all existing housing vouchers. An appropriation of less than that amount can readily be identified as a federal funding cut that would result in a particular number of vouchers being lost and a corresponding number of low-income families (or elderly or disabled individuals) not being served. Few policymakers are willing to advocate cutting the number of vouchers, and sufficient funding to renew all existing vouchers (or, for fiscal year 2003, all vouchers in use) is routinely provided. The Administration’s budget request for funding renewal of existing vouchers in fiscal year 2004, for example, was $668 million (5.4 percent) higher than the amount provided by Congress in fiscal year 2003. This substantial increase — requested at a time when the fiscal environment was generally tight — was driven by increases in the average voucher cost and the number of vouchers in use.
By contrast, under a block grant, there would be no specific appropriation level that could be identified as needed to assure that all existing vouchers are maintained. To be sure, it could be determined how much the block grant would need to keep pace with inflation, but that can be determined for virtually all discretionary programs. Each year’s Congressional Budget Office “baseline” shows the amount each program needs to stay even with inflation. Despite the CBO baseline, appropriations for numerous programs are frozen or increased by less than inflation each year.
Moreover, it would be virtually impossible to
identify what specific cuts in the voucher program would be instituted — and
who would be harmed — if the appropriations levels for the block grant fell
below the levels authorized. Such decisions would be made subsequently in
the states, not in
|
Would the Initial Block Grant Allocations Be Sufficient to Support All Currently Authorized Vouchers? Questions about whether the initial
block-grant allocations would be sufficient to maintain currently
authorized vouchers are raised by the new approach to voucher funding
that is taken in the recently enacted omnibus FY 2003 appropriations
bill. Under this approach (and the similar approach the Administration
has proposed for fiscal year 2004), state and local housing agencies
will receive funding based on the number of vouchers they are
authorized to administer that are actually in use. Some vouchers
authorized by Congress are not currently being used, largely because
some families are unable to find housing they can rent with their
vouchers. If the new approach reflected in the FY 2003 appropriations bill were used to set the initial funding level for the housing voucher block grant, states would receive initial funding that would be insufficient to administer their full allocation of vouchers. Funding levels for subsequent years would be derived from this low baseline level. |
The Case of the HOME Block Grant
The HOME housing block grant has done better than a number of other low-income block grants. Yet it still illustrates this phenomenon. Funding for HOME (excluding funds set aside for special purposes) rose by 26 percent from fiscal year 1992 (the first year the program was funded) to fiscal year 2003. During the most closely corresponding period for which data are available, the overall Consumer Price Index rose by 32 percent.[3] As a result, the HOME funding that states and localities are receiving in 2003 is worth only 95 percent of the funding they received in 1992, even though most states have experienced substantial population growth in the intervening period. Because rental housing costs have risen more rapidly than general inflation during this period, the level of housing production and other activities that the HOME grant is able to support has declined by a greater percentage in many areas. Moreover, in each year the level of funding appropriated for HOME has been below the authorized ceiling for the program.
Appendix
Methodology Used In
Cost-Index Analysis
The change in fair market rents (FMRs) reflects the change in final HUD FMRs from 1998 and 2003. FMRs include tenant-paid utilities. State FMRs were calculated by weighting FMRs for FMR areas (which include metropolitan areas, rural counties, and other “special” FMR areas) based on the number of renter households as reported in the 2000 census. National FMRs were calculated by weighting state FMRs based on the state’s voucher allocation. (Data on voucher allocations at the level of FMR areas were not available.)
The project-based Section 8 annual adjustment factor (AAF) is the product of the all-utilities-included AAFs for 1999, 2000, 2001, 2002, and 2003. AAFs are conversion percentages (e.g. 1.034 for a 3.4% increase) that are applied to the prior year’s contract rent, so the product of these five AAFs represents the total adjustment used for contracts from 1998 to 2003. State AAFs are calculated by weighting AAF areas (which include multi-state regions, states, metropolitan areas, and counties) based on the number of renter households as reported in the 2000 census and based on the 1998 FMR levels in the FMR areas that are included in the AAF area. National AAFs were calculated by weighting state AAFs based on the 1998 state FMR and the state’s voucher allocation. (Data on voucher allocations at the level of AAF areas were not available.)
The national consumer price index is the change in the CPI for all urban consumers between the July through December 1997 and July through December 2002. These periods were used because CPI data are not yet available for the period (October 2002 through September 2003) covered by the 2003 FMRs and AAFs, and July through December 2002 is the most recent six-month period for which data are available. As a result, the CPI for each year reflects a period with a midpoint (October 1) six months earlier than the midpoint (April 1) of the fiscal years to which the corresponding FMRs and AAFs apply.
The change in number of vouchers assumes an average cost per voucher equal to the FMR minus a tenant payment of $251. This amount reflects the average tenant payment in the voucher program according to data as of May 2001 from HUD’s Multifamily Tenant Characteristics System. For purposes of these calculations, the total number of vouchers in each state is based on HUD data for individual housing agencies from the HUDCAPS system, accessed November 25 -27, 2002, and available at <https://pic.hud.gov/pic/haprofiles/haprofilelist.asp>.
End Notes:
[1] Each fiscal year, agencies receive funding based on the actual cost of vouchers in the previous fiscal year, adjusted for inflation. If voucher costs exceed this level, the agency may draw on program reserves that are allocated to each agency to make up the difference. To date, these reserves have been adequate to cover the actual cost of administering authorized vouchers. Under the recently enacted fiscal year 2003 appropriations bill, housing agencies may also draw on a central reserve fund to meet excess costs.
[2] Another index that could be used to adjust funding is the Consumer Price Index for housing only. This index would appear to be a less likely candidate for use under a voucher block grant because, unlike the overall CPI, it is not commonly used as an inflation adjustment for government programs, and it would be less responsive to rental costs than the Section 8 Annual Adjustment Factors. During the five year period examined in this analysis, the national housing Consumer Price Index rose by 15.0 percent, an increase between the increase in the overall Consumer Price Index and the Section 8 Annual Adjustment factors.
[3] The CPI data used for this comparison are data for the overall CPI for the period from July-December 1991 to July- December 2002. The comparison in HOME funding is between fiscal year 1992 (October 1991-September 1992) and fiscal year 2003 (October 2002-September 2003). In fiscal year 1992, HOME received an appropriation of $1.5 billion, all of it for the core grants to states and localities. In fiscal year 2003, the program received $1.884 for the core grants, plus an additional $115 million set aside for special purposes.