|
March 29, 2007
NEW STUDY FINDS "DRAMATIC" REDUCTION SINCE 1960
IN
THE PROGRESSIVITY OF THE FEDERAL TAX SYSTEM:
Largest Reductions in Progressivity Occurred in 1980s and Since 2000
By Aviva Aron-Dine
In a new study, Thomas Piketty and Emmanuel Saez, economists who have done groundbreaking work on the historical evolution of income inequality in the United States, examine how the progressivity of the federal tax system has changed over time.[1] Unlike previous analyses, theirs examines effective federal tax rates going back to 1960, including income, payroll, corporate, and estate taxes, and provides data for income groups reaching up to the top one-hundredth of one percent (.01 percent) of the population.[2] Several crucial findings emerge from their study.
“The progressivity of the U.S. federal tax system at the top of the income distribution has declined dramatically since the 1960s.” As Figure 1 shows, since 1960, average federal tax rates for middle-income households have increased and then declined modestly. Over the same period, high-income households saw sharp drops in their federal tax rates.

Moreover, the drops were largest for the very highest-income households. The average tax rate declined by a larger amount for households in the top one hundredth of 1 percent of the income scale (where incomes in 2004 averaged about $15 million) than for households in the top tenth of 1 percent (where incomes averaged above $3.7 million) or for households in the top 1 percent (where incomes averaged about $850,000).
Over the same period in which the progressivity of the tax system declined, pre-tax income inequality grew significantly (see Figure 2). In an earlier study that examined the distribution of income since 1913, Piketty and Saez showed that the concentration of pre-tax income has increased substantially since the 1970s, especially at the very top of the income spectrum. [3] According to their data, the share of the nation’s pre-tax income flowing to the top 1 percent of households more than doubled between 1970 and 2000. Income inequality decreased in 2001 and 2002, following the decline in the stock market, but then started growing again in 2003. In 2004 and 2005 (the latest year for which data are available), income concentration increased markedly.
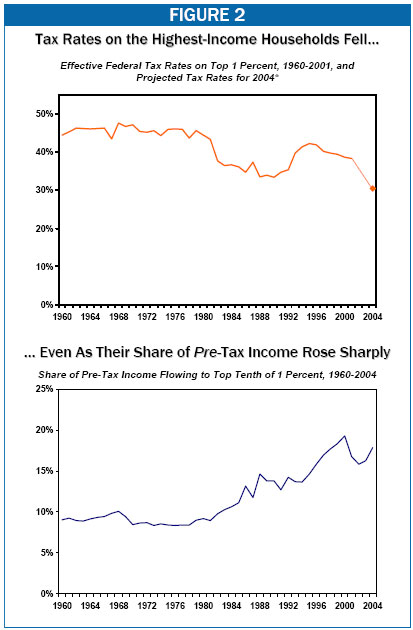
As a result, the share of the nation’s total income going to the top 1 percent of households jumped from 8.4 percent in 1970 to 19.3 percent in 2005, an increase of 10.8 percentage points. In 2005 terms, that increase works out to about $550,000 more in income per household for those in the top 1 percent. In other words, households in this income group received an average of about $550,000 more in income in 2005 than they would have if the group’s share of national had remained constant since 1970.
Over the same period in which high-income households benefited the most from changes in the distribution of pre-tax income, they also benefited the most from changes in effective federal tax rates. In 1970, the top 1 percent of households paid an average of 47 percent of their income in federal taxes; under 2004 law, Piketty and Saez estimate they faced an average tax rate of just 30 percent, a difference of 17 percentage points.[4] (2004 is the last year for which Piketty and Saez provide tax rate estimates.[5]) In 2004 terms, this difference works out to an average of more than $200,000 per household in additional after-tax income.
“Large reductions in tax progressivity since the 1960s took place primarily during two periods: the Reagan presidency in the 1980s and the Bush administration in the early 2000s.” Piketty and Saez attribute much of the decline in tax progressivity in the 1980s to a decline in corporate income tax and estate tax collections. But they note, “the tax reductions enacted in 2001 and 2003 have further weakened the redistributive power of the federal income tax.”
As Piketty and Saez point out, economists generally assess whether a tax system is progressive based on whether the distribution of after-tax income is more equal than the distribution of pre-tax income. They assess whether a tax cut is progressive based on whether it makes the distribution of after-tax income more or less equal.[6]
Like others who have examined the effects of the 2001 and 2003 tax cuts, Piketty and Saez find that the tax cuts made the distribution of after-tax income less equal. Specifically, their data show that, if 2004 tax rates (which reflect the impact of the tax cuts) had applied in 2000 (the year before the tax cuts took place), then the distribution of after-tax income in 2000 would have been more unequal than it actually was. Piketty and Saez estimate the tax rates in effect in 2004, based on 2004 tax law and 2000 income data.[7] According to their data, the top 1 percent of households held 16.6 percent of the nation’s total after-tax income in 2000. But if households had paid tax that year at the projected 2004 tax rates, the top 1 percent would have held 17.8 percent of after-tax income. In short, the tax cuts were regressive.
Because it omits the effects of those tax cuts enacted in 2001 that were not fully phased in by 2004 (such as the repeal by 2010 of the estate tax and of the provisions of the tax code that reduce the value of itemized deductions and personal exemptions for households at high income levels), Piketty and Saez’s simulation substantially understates the regressivity of the tax cuts once they are fully in effect. Even so, it offers additional confirmation that the tax cuts were regressive.
In sum, Piketty and Saez’s new study shows that the federal tax system has become much less progressive over the past several decades, and the 2001 and 2003 tax cuts have continued this trend. Over much the same several decades, pre-tax income inequality has grown as well. Thus, during a period in which economic forces have been generating increased pre-tax inequality, changes in the tax system have exacerbated rather than mitigated the widening of the income gap.
End Notes:
[1] Thomas Piketty and Emmanuel Saez, “How Progressive Is the U.S. Federal Tax System? A Historical and International Perspective,” Journal of Economic Perspectives, Winter 2007. Thomas Piketty is a professor of economics at the Paris School of Economics. Emmanuel Saez is a professor of economics at the University of California Berkeley. This analysis also relies on data the authors made available on the web: http://elsa.berkeley.edu/~saez/jep-results-standalone.xls.
[2] A household’s effective tax rate is the share of its income actually paid in taxes, taking into account deductions, exclusions, and other provisions that raise or lower tax liability. The Congressional Budget Office publishes data on effective federal tax rates going back to 1979 that include income, payroll, corporate, and excise taxes, but not estate taxes. CBO examines income groups up to the top 1 percent, but not groups within the top 1 percent. For those years and income groups for which CBO and Piketty and Saez both provide data, the trends in the data are very similar.
[3] Congressional Budget Office data show the same trend.
[4] For a discussion of the methodology Piketty and Saez use to calculate 2004 tax rates, see page 3.
[5] High-income households likely faced somewhat higher effective federal tax rates in 2005 because corporate tax revenues increased significantly in 2005. Economists generally assume that the burden of corporate taxes falls on households in proportion to their shares of total investment income; high-income households hold the lion’s share of investment income. As a result, increases in corporate tax payments generally raise effective tax rates for these households.
[6] Some supporters of recent tax cuts have claimed that these tax cuts are progressive because, since they were enacted, the share of taxes paid by high-income groups has increased. As Piketty and Saez point out, “when the share of income received by the top income groups is changing, the share of tax paid by those top income groups is a misleading method for evaluating the progressivity of the tax system.” This measure is also misleading when used to evaluate the progressivity of deficit-financed tax cuts. For further discussion, see Aviva Aron-Dine, “Have the 2001 and 2003 Tax Cuts Made the Tax Code More Progressive,” Center on Budget and Policy Priorities, March 19, 2007, https://www.cbpp.org/3-19-07tax.htm.
[7] Specifically, they use the available data on aggregate income growth between 2000 and 2004, but assume the 2000 income distribution. That is, they simulate what tax rates would have been in 2004 had all households’ incomes grown at the same rates between 2000 and 2004. (This approach is similar to that used by the Urban Institute-Brookings Institution Tax Policy Center and many other analysts.) In fact, the incomes of the highest income households grew less between 2000 and 2004 than those of other households (due to large income losses in 2001 and 2002, following the decline in the stock market). In actuality, therefore, the incomes of the highest-income households were lower in 2004 than Piketty and Saez assume for purposes of their simulation, and these lower incomes likely translated into lower tax rates. Thus, the actual decline in tax rates at the pinnacle of the income scale was likely slightly larger than Piketty and Saez project. Piketty and Saez’s methodology captures only the decline in effective rates due to legislative changes, not the decline in effective rates due to changes in the income distribution. |