|
Updated October 22, 2008
AVERAGE INCOME IN 2006 UP $60,000 FOR TOP 1 PERCENT OF HOUSEHOLDS, JUST $430 FOR BOTTOM 90 PERCENT:
Income Concentration at Highest Level Since 1928, New Analysis Shows
By Chye-Ching Huang and Chad Stone
Average pre-tax incomes in 2006 jumped by about $60,000 (5.8 percent) for the top 1 percent of households, but just $430 (1.4 percent) for the bottom 90 percent, after adjusting for inflation, according to a new update in the groundbreaking series on income inequality by economists Thomas Piketty and Emmanuel Saez. Their analysis of newly released IRS data shows that in 2006, the shares of the nation’s income flowing to the top 1 percent and top 0.1 percent of households were higher than in any year since 1928.
Piketty and Saez’s data series on income inequality, based on IRS files, is uniquely valuable because it provides detailed information on income gains at the top of the income scale and extends back to 1913. [1]
The new data show:
- 2006 marked the fourth straight year in which income gains at the top outpaced those among the rest of the population. Since 2002, the average inflation-adjusted income of the top 1 percent of households has risen 42 percent, whereas the average inflation-adjusted income of the bottom 90 percent of households has risen about 4.7 percent. (See Table 1.)
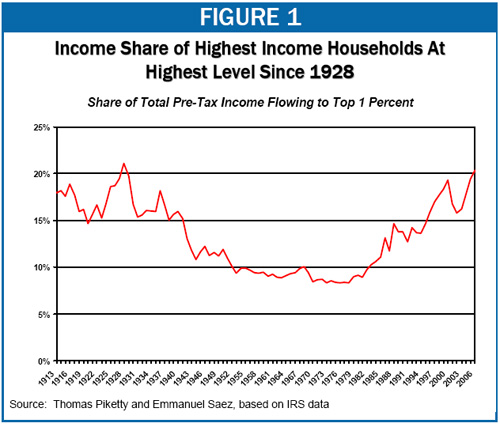
- As a result, the share of the nation’s income flowing to the top 1 percent has increased sharply, rising from 15.8 percent in 2002 to 20.0 percent in 2006. Not since 1928, just before the Great Depression, has the top 1 percent held such a large share of the nation’s income. (See Figure 1.) In 2000, at the peak of the 1990s boom, the top 1 percent received 19.3 percent of total income in the nation.[2]
- Income gains have been even more pronounced among those at the very top of the top 1 percent. The incomes of the top one-tenth of 1 percent (0.1 percent) of U.S. households have grown more rapidly than the incomes of the top 1 percent of households as a whole, rising by 58 percent, or $1.8 million per household, since 2002. The share of the nation’s income flowing to the top one-tenth of 1 percent increased from 6.5 percent in 2002 to 9.1 percent in 2006. This is the highest level since 1928.
|
Table 1:
Average Income Gains, Adjusted for Inflation, 2002-2006 |
|
|
Dollar Increase |
Percentage Increase |
| Bottom 90 percent |
$1,446 |
4.6% |
| Next 9 percent |
$14,496 |
10.0% |
| Top 1 percent |
$321,132 |
41.8% |
| Top 0.1 percent |
$1,809,824 |
57.6% |
| In 2006, the bottom 90 percent of households were those with incomes below about $105,000. The next 9 percent were those with incomes between $105,000 and about $368,000, and the top 0.1 percent were those with incomes above about $1,764,000. |
The uneven distribution of economic gains in recent years continues a longer-term trend that began in the late 1970s. In the three decades following World War II (1946-1976), robust economic gains were shared widely, with the incomes of the bottom 90 percent actually increasing more rapidly, on average, than the incomes of the top 1 percent. But in the three decades since 1976, the incomes of the bottom 90 percent of households have risen only slightly, on average, while the incomes of the top 1 percent have soared.[3] (See Figure 2.)

Given that the economy has undergone a significant slowdown, and given the turmoil in the financial markets, it seems possible that the income share of the top 1 percent will fall this year, and perhaps for several years after that. In this context, it is instructive to note how the distribution of income changed earlier this decade as a result of the dot.com collapse and the 2001 recession. The Piketty and Saez data show that the incomes of nearly all groups fell in 2001 and 2002. Since the incomes of those at the top of the income scale fell by the largest percentage, their share of total income in the nation declined.
In 2003, however, when income growth picked up, income concentration again began to rise. Some 42 percent of total income gains since 2002 have accrued to the top 1 percent of households, and 66 percent have gone to the top 10 percent of households. As a result, by 2006, the share of income flowing to the top 1 percent of households had surpassed the level it reached in 2000, at the peak of the 1990s expansion.
End Notes:
[1] Piketty and Saez rely on detailed Internal Revenue Service micro-files for most years, but use more aggregated IRS data and statistical techniques to extend their series back to 1913. Their July 2008 revision incorporates the detailed micro-files for 2006 that just became available to update their earlier preliminary estimates for 2006. For details on their methods, see Thomas Piketty and Emmanuel Saez, “Income Inequality in the United States: 1913-1998,” Quarterly Journal of Economics, February 2003, or, for a less technical summary, see http://elsa.berkeley.edu/~saez/saez-UStopincomes-2006prel.pdf. Their most recent estimates are available at http://elsa.berkeley.edu/~saez/TabFig2006.xls.
[2] Piketty and Saez present three different data series, each of which uses a different income concept, and therefore yields somewhat different estimates of the share of income going to each group. (For example, estimates of the share of income going to the top 1 percent in 2006 range from 17.98 percent in one series to 20.02 percent in the series we rely on here to 22.82 percent in the third series.) We focus on the series that includes capital gains income in measuring the income households receive, but ranks households according to their non-capital gains income. The authors indicate that this approach to sorting households gets around the volatility associated with capital gains realizations and provides a better measure of the underlying distribution of income than a measure that sorts households according to income including capital gains. But the authors also present a data series that includes capital gains income and ranks households by income including capital gains, as well as a series that excludes capital gains altogether. In 2006, under both income concepts that include capital gains income, the share of income flowing to the top 1 percent was at its highest level since 1928. Under the income concept that excludes capital gains, the income share going to the top 1 percent was at the highest level since 1929.
[3] Different data series show modestly larger or smaller gains for the bottom 90 percent, but all series show a similar discrepancy between the bottom 90 percent and the top 1 percent. |