
WHAT THE NEW
TRUSTEES' REPORT SHOWS ABOUT SOCIAL SECURITY
By
Jason Furman and
Robert Greenstein
|
PDF of
full report Statement on Annual Report of the Social Security and Medicare Trustees |
| If you cannot access the files through the links, right-click on the underlined text, click "Save Link As," download to your directory, and open the document in Adobe Acrobat Reader. |
On March 23, the Social Security Board of Trustees released the 65th annual report on the program’s financial and actuarial status. The report projects that Social Security’s trust fund reserves will run out in 2041, one year earlier than last year’s projection. After that year, the program will be able to pay 74 percent of scheduled benefits, rather than full benefits. Last year’s Trustees’ report projected the program would be able to pay 73 percent of scheduled benefits after the Trust Fund’s revenues are exhausted.
The report also shows that the trustees’ projection of the size of Social Security’s 75-year financing shortfall, measured both as a percentage of payroll and as a percentage of the economy, has increased very slightly from the projection of a year ago. This increase is entirely the result of shifting the 75-year period forward one year, which has the effect of including an additional year of deficits in the estimate.
Overall, the new trustees report presents projections very similar to those contained in last year’s trustees’ report. The 2005 report is slightly more pessimistic about the next two decades, projecting smaller cash surpluses (or larger cash deficits) than were projected in last year’s report. This is largely because 2004 witnessed lower interest rates and higher inflation than last year’s report projected. As a result, the insolvency date has been moved up one year. But the 2005 report is also slightly more optimistic about the longer-term outlook, projecting smaller cash deficits after 2024 than were projected in last year’s report.[1] As a result, the overall outlook for comparable 75-year periods has improved slightly. One manifestation is the slight improvement in the percentage of benefits payable after the trust fund is exhausted: as noted, this year’s report estimates that 74 percent of benefits would be payable with tax revenues after the trust fund is exhausted; last year’s report estimated that 73 percent of benefits would be payable.
In general, the key dates and the overall financial picture in the trustees’ report represent improvement over the trustees’ 1997-2001 reports and little change from the 2002-2004 reports (see Table 1). The long-term deficit in Social Security declined from 2.23 percent of taxable payroll in the 1997 report to 1.89 percent in the 2000 report and has changed little since then. The date by which the trust fund is projected to be exhausted has moved farther into the future — from 2029, as forecast in 1997, to 2041 as projected in the current report.
The projections in the trustees’ report differ from those released by the Congressional Budget Office in January. CBO projects that the trust fund will be exhausted in 2052 (rather than 2041), after which tax revenues will be sufficient to pay 78 percent of benefits. CBO projects a 75-year shortfall of 1.0 percent of taxable payroll and 0.4 percent of the Gross Domestic Product. CBO is more optimistic in part because it assumes stronger economic growth and in part because of technical differences in the projection methodology.
Policy Implications
The trustees’ report reaffirms that Social Security does not face a near-term crisis and can pay full benefits for the next 36 years but will eventually face a significant imbalance. A sizeable shortfall between Social Security income and Social Security benefit entitlements should not be acceptable to the public or policymakers, and action is needed to restore the program’s long-term solvency. President Bush’s proposal to shift payroll taxes into individual accounts would not help to close the Social Security shortfall, however, and could make the challenge greater. In the absence of any benefit cuts, the President’s private accounts would cause the trust fund to become insolvent 11 years earlier, in 2030 rather than 2041.
This imbalance in Social Security contributes to the long-term U.S. budget deficit, but accounts for a relatively small part of that deficit; the tax cuts enacted since 2001 are much larger (assuming they are extended, as the President has proposed). According to the trustees’ report, Social Security faces a deficit of 0.65 percent of GDP over the next 75 years. The Congressional Budget Office estimates the 75-year shortfall in Social Security at 0.37 percent of GDP. The tax cuts, in contrast, are projected to cost 2 percent of GDP through 2079 (based on CBO estimates of the cost of extending the tax cuts through 2015). [2] Thus, the tax cuts would cost three times as much over 75 years as the trustees’ estimate of the Social Security shortfall and more than five times as much as CBO’s estimate of the shortfall.
Overview of the Projections in the New Trustees’ Report
The new trustees’ report contains several key figures that document the challenge Social Security faces:
- The trustees project that in 2017, benefit payments will begin to exceed Social Security’s tax revenues. At this point, Social Security will have start using some of the interest it earns on its trust fund bonds to pay benefits. The trustees project that in 2017, the trust fund will have $4.7 trillion in assets; it will grow by another $1.3 trillion over the following 9 years.[3]
- The balances in the trust fund will peak in 2027. After this date, Social Security will start redeeming the bonds in the trust fund to raise the additional funds needed to pay full benefits. The combination of tax revenues, interest earnings, and income from redeeming Treasury bonds will be sufficient for Social Security to pay full benefits for another 14 years after 2027.
- The trustees project that the Trust Fund will be exhausted in 2041. After that, the trust fund will continue to receive annual revenues from payroll taxes and from the partial taxation of the benefits that higher-income beneficiaries receive. This revenue, however, will not be sufficient to pay full benefits.
- After the trust fund is exhausted, Social Security’s tax revenue will be sufficient to pay 74 percent of promised benefits. This percentage will fall gradually to 68 percent of benefits in 2079.
- The new report places the amount of the 75-year shortfall — that is, the amount by which the trust fund’s income and revenues over the next 75 years will fall short of what is needed to pay full benefits over the period — at $4.0 trillion in net present value.[4] That is 1.92 percent of taxable payroll over the 75-year period, or 0.6 percent of GDP.[5] For purely technical reasons, this measure is slightly larger than the 1.89 percent shortfall estimated in last year’s report.[6]
- The new report places the “infinite horizon” shortfall at 1.2 percent of GDP and 3.5 percent of taxable payroll, which is unchanged from last year’s estimate. The infinite horizon measure was first included in the 2003 report and has been strongly criticized by the American Academy of Actuaries and other Social Security analysts for reasons described, in part, in the box on page 5. Among other issues, more than two-thirds of the infinite horizon deficit would be incurred after 2079, making it very sensitive to small changes in assumptions and hence of limited reliability for policymakers.
Private Accounts Would Make the Problem Worse
Private accounts, unless financed by contemporaneous benefit reductions or tax increases, entail trillions of dollars of borrowing. Accounts add to Social Security’s financing problems rather than reducing them.
Source: Trustees Reports, various years. |
||||||||||||||||||||||||||||||||||||||||||||||||||||||||||||
The President’s proposal to allow workers to divert 4 percent of taxable earnings into private accounts each year would raise the government’s total debt by $1.4 trillion over the first 10 years of the plan (2009-2018) and $4.9 trillion over the first 20 years of the plan (2009-2028). Large reductions in traditional Social Security benefits would be required to repay this debt over time. (The President’s plan calls for reducing Social Security benefits for those opting for the private accounts by an amount equal to the monthly annuitized value that a worker’s private account would have if the funds deposited in it had earned interest at a rate 3 percent above inflation.) The combination of diverting money into private accounts and then repaying the resulting debt would leave the trust fund no better off than it is now. Still larger benefit cuts would be necessary to restore solvency.
The President’s accounts also would advance the date at which Social Security needs to draw on the trust fund to pay Social Security benefits. Diverting payroll taxes into private accounts would reduce the revenue available to pay Social Security benefits and thereby advance the date when the program’s benefit costs exceed its non-interest income. According to analysis by the Center on Budget and Policy Priorities updating an analysis by the Social Security actuaries issued last month, by 2011 tax revenues would no longer be sufficient to pay benefits and the Social Security system would have to start using the interest on the trust fund.[7] That is six years earlier than under current law. The actuaries’ memo does not provide any estimates past 2015, but a conservative extrapolation by the Center on Budget and Policy Priorities shows that the President’s accounts, by themselves and without additional benefit reductions, would advance the insolvency of Social Security by 11 years, from 2041 to 2030 (see Table 2).
|
TRUSTEES’ PROJECTIONS |
CBO PROJECTIONS |
|||
|
Current Law |
CBPP Estimate of President’s Accounts |
Current Law |
CBPP Estimate of President’s Accounts |
|
| Benefits Exceed Tax Revenues |
2017 |
2011 |
2020 |
2013 |
| Benefits Exceed All Revenues |
2027 |
2019 |
2033 |
2023 |
| Trust Fund Is Exhausted |
2041 |
2030 |
2052 |
2036 |
| Source: Current law estimates are from Social Security Trustees and 2005 Annual Report and CBO, Updated Long-Term Projections for Social Security, March 2005. Estimates of the Presidents accounts are based on Stephen Goss, Chief Actuary, Social Security Administration, “Preliminary Estimated Effects of a Proposal to Phase In Personal Accounts,” February 3, 2005. CBPP extrapolated these estimates past 2015. | ||||
What Happens after 2017?
Some have raised the concern that Social Security will have to start relying on “worthless IOUs” as soon as 2017. As a legal matter, this belief is mistaken. The trust fund holds Treasury bonds, the world’s safest asset. According to the Social Security trustees, “Just as in the case of marketable Treasury securities held by the public, all of the investments held by the trust funds are backed by the full faith and credit of the U.S. Government.” No legislative action is required by Congress to pay full benefits prior to 2041, the exhaustion of the trust fund.
To be sure, without changes in policy, the nation faces very large budget deficits in future decades. But this does not mean the Treasury will fail to honor its bonds. The U.S. government has run deficits in 72 of the last 100 years but has always honored all of its bonds. Never in the nation’s history has the government defaulted on its bonds. (If it did so, that could trigger an international financial crisis.)
Moreover, Social Security will contribute only modestly to the deficits the nation will face in the years after 2017. For example, the new trustees’ report shows that the difference between Social Security’s benefit costs and its non-interest revenues will be 0.9 percent of GDP in 2025. That is less than one-seventh of the deficit projected in 2025, assuming the tax cuts are extended, according to Center on Budget and Policy Priorities analysis. It is also substantially smaller than the size of the tax cuts, which will cost approximately two percent of GDP in 2025 if extended.
|
Did Social Security’s Shortfall Get $700 Billion Larger? This year, the Social Security trustees project that over an infinite horizon, Social Security faces a deficit of $11.1 trillion or 1.2 percent of GDP. This measure is unchanged from last year, when Social Security’s infinite horizon deficit was also projected to be 1.2 percent of GDP. Some may try to claim that the infinite horizon deficit increased by $700 billion.* This, however, is a misleading apples-to-oranges comparison. In 2004, the infinite horizon deficit was estimated at $10.4 trillion in net present value expressed in 2004 dollars. This is not directly comparable to this year’s estimate of $11.1 trillion, which represents net present value expressed in 2005 dollars. The net present value estimate will almost always increase from year to year solely because of the general fact that future dollars are worth less than current dollars. This does not mean the shortfall itself is getting larger. Put another way, last year the Social Security trustees projected that GDP over an infinite horizon would be $844 trillion. This year, the trustees project that GDP over an infinite horizon would be $921 trillion. So, using the same apples-to-oranges comparison, infinite-period GDP has gone up $77 trillion. Yet the nation has not magically gotten $77 trillion richer in one year. Nor has the Social Security outlook gotten $700 billion worse. On an apples-to-apples basis, the infinite horizon deficit as a share of taxable payroll or as a share of the economy is unchanged. That means that roughly the same magnitude of tax increases or benefit reductions would be required to restore solvency this year as was the case last year. It remains true, however, that acting sooner rather than waiting for an extended period of time will require smaller benefit cuts or tax increases to restore solvency. The danger of focusing too much on the dollar value of the infinite horizon deficit and on the apples-to-oranges comparison from year to year was one of the principal reasons that the American Academy of Actuaries warned against including infinite horizon estimates in the trustees’ report: The Committee [the Social Insurance Committee of the American Academy of Actuaries] believes that the new measures of OASDI’s unfunded obligations included in the 2003 report provide little if any useful information about the program’s long-range finances and indeed are likely to mislead anyone lacking technical expertise in the demographic, economic and actuarial aspects of the program’s finances into believing that the program is in far worse financial condition than is actually indicated… The infinite-time-horizon unfunded-obligations estimate [in dollar terms] increases each year… The public, seeing annual large increases in unfunded obligations, is likely to be misled into believing that the program’s financial situation is deteriorating and the cost of restoring actuarial balance is increasing, even if this is not the case.†† -------------------------- |
Social Security and the Long-Run Fiscal Challenge
The Social Security shortfall contributes to the government’s long-term fiscal challenge, but it is by no means the primary source of this challenge. Nevertheless, eliminating Social Security’s shortfall would be an important step in addressing America’s overall fiscal challenges.
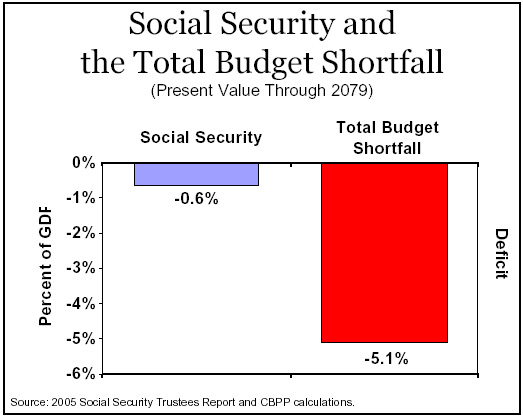 Over
the next 75 years, the Social Security shortfall is modest relative to the
size of the federal budget shortfall outside of Social Security.
Through 2079, we estimate that the federal budget as a whole faces a shortfall
equal to 5.1 percent of GDP, assuming the 2001 and 2003 tax cuts and other
temporary tax measures are extended as proposed by the President. Other
independent analysts have calculated that the long-term total fiscal shortfall
may be of similar magnitude or even larger than shown here. Using somewhat
different methodology, Brookings Institution economists calculate that the
75-year shortfall will amount to 7 percent of GDP, while a study from the
American Enterprise Institute sets the long-term (infinite horizon) fiscal
shortfall at about 6.5 percent of GDP.[8]
Over
the next 75 years, the Social Security shortfall is modest relative to the
size of the federal budget shortfall outside of Social Security.
Through 2079, we estimate that the federal budget as a whole faces a shortfall
equal to 5.1 percent of GDP, assuming the 2001 and 2003 tax cuts and other
temporary tax measures are extended as proposed by the President. Other
independent analysts have calculated that the long-term total fiscal shortfall
may be of similar magnitude or even larger than shown here. Using somewhat
different methodology, Brookings Institution economists calculate that the
75-year shortfall will amount to 7 percent of GDP, while a study from the
American Enterprise Institute sets the long-term (infinite horizon) fiscal
shortfall at about 6.5 percent of GDP.[8]
The 75-year Social Security shortfall amounts to only 0.6 percent of GDP, or 13 percent of the total, by our estimates. The rest of the federal budget shortfall — equivalent to 4.4 percent of GDP — will occur outside of Social Security. In other words, the federal budget shortfall outside of Social Security is nearly seven times the Social Security shortfall.
Recently enacted policies, particularly the tax cuts (if made permanent) and the prescription drug benefit, will have a much larger impact on the long-term fiscal deficit. The tax cuts since 2001, assuming they are made permanent (and relief from the AMT is continued), are projected to cost 2.0 percent of GDP over the next 75 years, or $12.3 trillion in net present value. This is three times greater than the Social Security trustees’ estimate of the Social Security shortfall and six times greater than CBO’s estimate. The new prescription drug benefit also will cost more than the Social Security shortfall, totaling $8.7 trillion over the next 75 years, as will the Medicare Hospital Insurance program, at $8.6 trillion over 75 years.
|
Table 3 |
|||||||||||||||||||||
|
The Shortfall in the Social Security Trust Fund Compared to Other Sources of Deficits
a. Measured in present value in 2005 dollars. b. Source: Calculations from data supporting, Congressional Budget Office, Updated Long-Term Projections for Social Security, March 2005. CBO’s data show that the 0.37-percent-of-GDP Social Security shortfall is equivalent to a $2.1 trillion shortfall. Because CBO uses GDP and discount rate assumptions that differ from those used by the Trustees, CBO’s $2.1 trillion estimate is not comparable to the Trustees’ $4.0 trillion estimate. However, CBO’s 0.37 percent-of-GDP figure is comparable to the Trustees’ 0.65 percent figure. c. Source: Calculations from the Trustees’ report, 2005 Annual Report of the Old-Age and Survivors Insurance And Disability Insurance Trust Funds. d. Source: 2005 Annual Report of the Boards of Trustees of the Federal Hospital Insurance And Federal Supplementary Medical Insurance Trust Funds, page 112. The figure represents the net federal cost of the drug benefit, i.e., the benefit payments minus premium payments from beneficiaries and “clawback” payments from states. e. Source: Center on Budget and Policy Priorities. The estimate of the cost of the tax cuts enacted since 2001 — 1.99 percent of GDP — is based on cost estimates of the Joint Committee on Taxation for tax cuts enacted to date, and estimates issued by CBO for the cost of extending the 2001 and 2003 tax cuts, as proposed by the President, and continuing relief from the Alternative Minimum Tax. See footnote 2 for more details. |
Conclusion
The new trustees’ report is consistent with previous reports. It shows that Social Security faces a significant but manageable challenge. While acting sooner rather than later will help reduce the size of the eventual adjustments, the trustees’ report indicates that Social Security does not face a deep structural crisis requiring drastic changes.
In 1983, Congress and President Reagan acted on recommendations made by the Greenspan Commission and strengthened Social Security’s financial status through a combination of benefit and revenue measures. Various combinations of modest benefit reductions and revenue increases have now been proposed by economists Peter Diamond and Peter Orszag, former Social Security Commissioner Robert Ball, and AARP. Such steps could restore Social Security solvency while beginning to reduce federal deficits and debt immediately, rather than entailing substantial new borrowing and additional debt.
End Notes:
[1] These changes are shown in Figure II.D6 of the new trustees report.
[2] The 75-year estimates of the cost of the tax cuts cited here are based on the standard procedure of assuming that the cost of tax cuts as a share of GDP remains constant once the tax cuts are fully in effect. These estimates reflect the cost of the tax cuts and the associated cost of the portion of AMT relief necessitated by the tax cuts (as distinguished from the full cost of AMT relief). These estimates do not include the cost of extending the temporary tax cuts in law prior to 2001 that have since been extended. The Center on Budget and Policy Priorities estimate is slightly smaller than the 2.2 percent of GDP estimate of the cost of the tax cuts through the next 75 years made by Alan J. Auerbach, William G. Gale, and Peter R. Orszag, “Sources of the Long-Term Fiscal Gap,” Tax Notes, May 24, 2004. For more details, see Richard Kogan and Robert Greenstein, “President Portrays Social Security Shortfall As Enormous But His Tax Cuts and Drug Benefit Will Cost At Least Five Times As Much,” Center on Budget and Policy Priorities, February 11, 2005.
[3] Technically, Social Security has two distinct trust funds: one for old-age and survivors benefits and one for disability benefits. This report follows the standard convention in referring to the combined balance as the Social Security trust fund.
[4] Net present value is the equivalent amount that today, with interest, would exactly cover these future costs.
[5] Note, per the Trustees’ convention, the deficit as a share of taxable payroll also includes the cost of a “target fund” – that is a trust fund balance at the end of 2079 that would be sufficient to pay full benefits in 2080.
[6] Last year’s estimate of the shortfall covered the 2004-2078 period while this year’s estimate covers the 2005-2079 period. The Trustees estimate that adding a deficit year (2079) and subtracting a surplus year (2004) added 0.07 percent of payroll to the reported shortfall, the so-called “valuation period effect.” Changes in economic and demographic assumptions and methods improved the 75-year outlook by a very modest 0.03 percent of taxable payroll.
[7] This date was 2012, according to estimates by the Social Security actuaries based on the 2004 Trustees assumptions, see Stephen Goss, Chief Actuary, Social Security Administration, “Preliminary Estimated Effects of a Proposal to Phase In Personal Accounts,” February 3, 2005. This memo estimated that accounts would cost $95 billion in 2011. This is larger than the $88 billion cash surplus for 2011 projected in the 2005 Trustees report.
[8] See William G. Gale and Peter R. Orszag, Brookings Institution, “The Budget Outlook: Projections and Implications,” Economists Voice, 2004. Also, Jagadeesh Gokhale and Kent Smetters, American Enterprise Institute, Fiscal and Generational Imbalances: New Budget Measures for New Budget Priorities, 2003.