|
March 16, 2006
TAX CUTS PROPOSED IN PRESIDENT’S BUDGET WOULD ULTIMATELY CAUSE LARGE STATE REVENUE LOSSES
By Iris J. Lav
Summary
When the federal government cuts taxes, those tax cuts sometimes cause reductions in state revenue as well. This occurs because most states with individual and/or corporate income taxes use the federal definitions of adjusted gross income and corporate income as the basis for their own income taxes. When a tax cut reduces the amount of income that is taxable for federal tax purposes, it often also reduces the amount of income taxable for state tax purposes.
The fiscal year 2007 budget that the President submitted on February 6 includes large proposed new tax cuts. At least 16 of the tax-cut provisions proposed in the budget would affect state revenues, causing states to lose as much as $38 billion over the next ten years. Of the 16 provisions that would affect state revenue, 13 would reduce revenue while three would result in very small state revenue gains.
Among the provisions that would reduce state revenues are: the expansion of tax breaks for Health Savings Accounts, a permanent increase in expensing for small businesses, permanent extension of the higher contribution limits for IRAs and 401(k)s enacted in 2001 and consolidation of employer-based retirement accounts, allowance of tax-free withdrawals from IRAs for charitable giving, and expansion of Opportunity Zones. Another set of provisions — the expansion of Roth IRAs (renamed Retirement Savings Accounts) and the creation of Lifetime Savings Accounts — would increase both federal and state revenues in the near term but cause larger federal and state revenue losses over time. Similarly, a proposed change in the required funding for single-employer pension plans is designed to yield short-term revenue gains but would result in long-term revenue losses. (The tax cuts are listed in the Appendix table.)
Table 1 shows the potential revenue loss by state over the next five years and the next ten years.[1]
|
TABLE 1: POTENTIAL STATE REVENUE LOSS IF FEDERAL TAX
PROPOSALS WERE ENACTED
(In millions of dollars) |
|
|
2007-2011 |
2012-2016 |
2007-2016 |
|
Alabama |
-22 |
-465 |
-486 |
|
Alaska |
-22 |
-26 |
-48 |
|
Arizona |
-85 |
-422 |
-507 |
|
Arkansas |
-65 |
-326 |
-392 |
|
California |
778 |
-5,739 |
-4,960 |
|
Colorado |
-215 |
-612 |
-827 |
|
Connecticut |
-249 |
-640 |
-888 |
|
Delaware |
-61 |
-156 |
-216 |
|
Florida |
-94 |
-112 |
-206 |
|
Georgia |
-447 |
-1,304 |
-1,751 |
|
Hawaii |
-42 |
-211 |
-253 |
|
Idaho |
-66 |
-198 |
-264 |
|
Illinois |
-599 |
-1,517 |
-2,115 |
|
Indiana |
-279 |
-787 |
-1,066 |
|
Iowa |
-74 |
-371 |
-446 |
|
Kansas |
-129 |
-377 |
-506 |
|
Kentucky |
-108 |
-540 |
-649 |
|
Louisiana |
-153 |
-445 |
-598 |
|
Maine |
-8 |
-241 |
-250 |
|
Maryland |
-337 |
-949 |
-1,286 |
|
Massachusetts |
-570 |
-1,481 |
-2,051 |
|
Michigan |
-223 |
-1,112 |
-1,335 |
|
Minnesota |
-381 |
-1,070 |
-1,450 |
|
Mississippi |
-87 |
-247 |
-333 |
|
Missouri |
-244 |
-725 |
-969 |
|
Montana |
-44 |
-130 |
-174 |
|
Nebraska |
-89 |
-255 |
-343 |
|
New Hampshire |
-4 |
-18 |
-22 |
|
New Jersey |
-22 |
-900 |
-921 |
|
New Mexico |
-74 |
-216 |
-290 |
|
New York |
-1,481 |
-3,985 |
-5,467 |
|
North Carolina |
-527 |
-1,538 |
-2,065 |
|
North Dakota |
-17 |
-46 |
-63 |
|
Ohio |
-319 |
-1,588 |
-1,906 |
|
Oklahoma |
-155 |
-468 |
-624 |
|
Oregon |
-290 |
-865 |
-1,155 |
|
Pennsylvania |
-344 |
-1,377 |
-1,722 |
|
Rhode Island |
-30 |
-149 |
-179 |
|
South Carolina |
-172 |
-521 |
-693 |
|
Tennessee |
-49 |
-56 |
-105 |
|
Texas |
-120 |
-142 |
-262 |
|
Utah |
-122 |
-374 |
-497 |
|
Vermont |
-31 |
-87 |
-118 |
|
Virginia |
-460 |
-1,317 |
-1,777 |
|
West Virginia |
-82 |
-238 |
-320 |
|
Wisconsin |
123 |
-952 |
-829 |
|
District of Columbia |
-66 |
-166 |
-232 |
|
|
|
|
|
|
Total |
-8,155 |
-35,462 |
-43,618 |
|
Notes: Alabama: excludes HSA expansion for first five years; Arizona: excludes section 179; Arkansas: excludes Section 179; California: excludes HSA expansion for first five years, Section 179, educators' expense deduction, and brownfield remediation; Hawaii: excludes Section 179; Iowa: excludes Section 179; Kentucky: excludes Section 179; Maine: excludes HSA expansion for first five years; Michigan: excludes Section 179 and corporate provisions; New Hampshire: excludes Section 179; New Jersey: excludes HSA expansion for first five years, Section 179, tax-free withdrawals from IRAs for charitable purposes, deduction for classroom expense, and opportunity zones. Also excludes employer-based savings changes and revenue gains in first four years from IRA conversions; Ohio: excludes Section 179; Pennsylvania: excludes HSA expansion for first five years, tax-free withdrawals from IRAs for charitable purposes, deduction for classroom expense, opportunity zones and revenue gains in first four years from IRA conversions; Rhode Island: excludes Section 179; Wisconsin: excludes HSA expansion for first five years and Section 179. Personal income tax items are excluded in states without personal income taxes. (For a discussion of these exclusions, see the methodology section of this paper on page 9.) |
-
Some of the largest losses in dollar terms over the next five years would be likely to occur in New York, Illinois, Massachusetts, North Carolina, Virginia, and Georgia.
-
The state revenue loss in the second five years would be $35 billion, more than four times the loss in the first five years, bringing the ten-year loss to $43 billion. The state losses mount rapidly after the first five years because the revenue-reduction impact in the first few years is partially masked by provisions, such as the changes in the treatment of retirement accounts, that raise some revenue in the short run but generate much larger revenue losses after that.
- The states with the largest ten-year revenue losses, in dollar terms, include New York, California, Illinois, North Carolina, Massachusetts, Ohio, Virginia, Georgia, Pennsylvania, and Michigan.[2]
Table 2 provides a different way to look at the state revenue losses that could occur — in per capita terms rather than simply in overall dollar terms. Like Table 1, it examines the revenue losses for both the first five and the second five years.
-
The states that could experience the largest per-capita losses in the second five years, when the full losses would first appear, are Massachusetts, Oregon, New York, Minnesota, Connecticut, Maine, Delaware, Wisconsin, Virginia, and North Carolina.
-
In Massachusetts, for example, the revenue loss would average $44 per capita per year — or $176 annually for a family of four — in the period from 2012 to 2016. That is a very significant amount of revenue for a state to try to replace. In North Carolina, the loss would be $31 per capita per year or $125 for a family of four.
As noted, the annual state revenue loss would reach $8.1 billion by 2016, and would continue to grow in subsequent years. That means that the largest revenue losses from these proposals would occur as the baby-boom generation retires and states begin to face the higher costs (and other issues) associated with that retirement. Costs for state pensions, retiree health insurance, and Medicaid will increase as the baby boomers age. States will bear a particularly heavy burden for health care for the aging population, since it is Medicaid (rather than the federal Medicare program) that pays for long-term care. The significant revenue losses that these budget proposals would engender would make it still more difficult for states to meet these responsibilities.
The nature of these tax proposals makes it particularly likely that states will conform to the proposed changes in federal law and thus incur these revenue losses. While there have been circumstances in the recent past under which some states have declined to accept federal tax-law changes and the attendant state revenue losses (that is, circumstances under which states have “decoupled” from the federal provisions), it would be difficult for states to avoid accepting the federal treatment of many of these particular tax cuts. For example, if Health Savings Accounts become a major method by which Americans pay for health care — as the Administration intends — states will face strong pressures to provide tax breaks comparable to the federal treatment. To a great degree, this pressure already has appeared; all but six of the states with an income tax have conformed at least in significant part to the federal treatment of HSAs. (Because of the high level of conformity, this analysis assumes that all states will follow federal HSA rules by 2012.)
Similarly, when Individual Retirement Accounts were first offered, some states denied the state tax breaks that would have corresponded to the federal treatment. Now nearly all states conform to most aspects of federal IRA policy, making it likely they would conform to the proposed Retirement and Lifetime Savings Accounts as well.
Major Proposed Tax Changes
The following describe some of the proposed federal tax changes and their potential impact on state revenues. These provisions account for the bulk of the revenue loss.
Health Savings Accounts
The greatest revenue loss over the next ten years would result from the proposed changes in the treatment of Health Savings Accounts. Health Savings Accounts are tax-advantaged accounts that are used in conjunction with the purchase of high-deductible health insurance policies. The Administration proposes a series of changes to HSA policy that are designed to make the accounts and high-deductible policies more attractive. Most of these changes would affect state revenues.
|
TABLE 2: POTENTIAL PER CAPITA STATE REVENUE LOSS
IF FEDERAL TAX PROPOSALS WERE ENACTED |
|
|
|
|
Rank |
|
|
2007-2011 |
2012-2016 |
2012-2016 |
|
Alabama |
-4.79 |
-99.90 |
36 |
|
Alaska |
-32.26 |
-36.33 |
42 |
|
Arizona |
-13.09 |
-57.72 |
41 |
|
Arkansas |
-22.93 |
-110.62 |
32 |
|
California |
20.67 |
-144.52 |
13 |
|
Colorado |
-44.91 |
-122.31 |
27 |
|
Connecticut |
-69.84 |
-176.47 |
5 |
|
Delaware |
-69.16 |
-169.72 |
7 |
|
Florida |
-4.98 |
-5.37 |
46 |
|
Georgia |
-47.27 |
-129.07 |
22 |
|
Hawaii |
-31.81 |
-152.95 |
12 |
|
Idaho |
-44.31 |
-123.14 |
25 |
|
Illinois |
-46.50 |
-116.10 |
30 |
|
Indiana |
-43.91 |
-121.13 |
28 |
|
Iowa |
-24.79 |
-122.75 |
26 |
|
Kansas |
-46.15 |
-132.55 |
17 |
|
Kentucky |
-25.54 |
-124.65 |
24 |
|
Louisiana |
-33.21 |
-95.48 |
38 |
|
Maine |
-6.06 |
-174.54 |
6 |
|
Maryland |
-57.65 |
-154.40 |
11 |
|
Massachusetts |
-86.01 |
-219.89 |
1 |
|
Michigan |
-21.47 |
-105.21 |
35 |
|
Minnesota |
-70.88 |
-190.39 |
4 |
|
Mississippi |
-29.24 |
-82.02 |
39 |
|
Missouri |
-41.46 |
-120.05 |
29 |
|
Montana |
-45.47 |
-130.95 |
19 |
|
Nebraska |
-50.25 |
-142.67 |
14 |
|
New Hampshire |
-2.69 |
-12.51 |
43 |
|
New Jersey |
-2.40 |
-97.70 |
37 |
|
New Mexico |
-37.58 |
-106.27 |
34 |
|
New York |
-76.31 |
-204.08 |
3 |
|
North Carolina |
-57.17 |
-155.68 |
10 |
|
North Dakota |
-26.39 |
-72.80 |
40 |
|
Ohio |
-27.57 |
-136.57 |
15 |
|
Oklahoma |
-43.38 |
-128.44 |
23 |
|
Oregon |
-77.29 |
-217.96 |
2 |
|
Pennsylvania |
-27.42 |
-108.57 |
33 |
|
Rhode Island |
-26.91 |
-131.26 |
18 |
|
South Carolina |
-38.98 |
-113.23 |
31 |
|
Tennessee |
-7.95 |
-8.70 |
44 |
|
Texas |
-4.93 |
-5.43 |
45 |
|
Utah |
-47.73 |
-136.44 |
16 |
|
Vermont |
-47.41 |
-130.53 |
20 |
|
Virginia |
-58.08 |
-157.25 |
9 |
|
West Virginia |
-44.83 |
-130.49 |
21 |
|
Wisconsin |
21.65 |
-162.74 |
8 |
|
|
|
District of Columbia |
-80.99 |
-290.63 |
|
Specifically, the President is proposing a large increase in the amount of money that can be deposited annually in an HSA and deducted from income. In addition, the Administration is proposing a new deduction for amounts spent on insurance premiums for high-deductible insurance policies that are purchased in the individual market by people using HSAs. Both of these deductions would reduce the amount of income that people report on their state income taxes in most states. (The proposals also include tax credits, on top of the deduction for contributions made to an HSA, and another tax credit on top of the deduction for premiums paid. The tax credits would not affect state revenues.) The HSA proposals would reduce federal revenue by $156 billion over ten years and substantially more in subsequent decades, with the two deductions that could affect state revenue accounting for about $115 billion of the $156 billion.[3]
As noted above, most states have adopted federal treatment of HSAs under current law. All but six states with an income tax have conformed to all or most of the current federal tax treatment of HSAs. (The six states that have not conformed are Alabama, California, Maine, New Jersey, Pennsylvania, and Wisconsin.) This analysis assumes that the states that have not conformed to date will continue their nonconformity for the next five years, a conservative assumption since a number of them are under intense pressure from pro-HSA forces to conform now. After 2011, it is assumed that all states conform. If these HSA tax breaks induce a significant number of Americans to switch to paying for health care in this manner, as the Administration envisions, it will become difficult for states to resist conforming to the federal treatment.
The state revenue loss from conforming to the federal HSA provisions would be approximately $7.7 billion over the next five years from 2007 through 2011. For the ten-year period from 2007 through 2016, the revenue loss would amount to more than $26 billion.[4]
Savings Incentives
The President’s budget proposes to establish tax-favored “Lifetime Savings Accounts” and to replace existing Individual Retirement Accounts with “Retirement Savings Accounts.” The RSAs would operate like current-law Roth IRAs; contributions would not be deductible, but earnings would accumulate tax free and distributions for retirement income would be excluded from gross income. The LSAs would operate in a similar manner, except that withdrawals could be made at any time and for any purpose.
The cost of these proposals appears modest in the short term but grows rapidly over time. This is true for several related reasons. First, since contributions to these accounts are not deductible, the revenue loss accrues slowly and mounts over time as earnings grow tax free on the funds in the accounts. Second, the proposal ends tax-deductible contributions to traditional IRAs; many of the funds that otherwise would be placed in traditional IRAs and result in an immediate tax deduction would be placed in RSAs instead, under which the big tax breaks come when funds are withdrawn in retirement, rather than when the funds are deposited in the accounts.
The proposal would generate revenue in the first four years after enactment for another reason as well. It would use a timing gimmick to accelerate into the next four years many billions of dollars of taxes that otherwise would be collected in subsequent decades. Specifically, it would encourage taxpayers to convert existing traditional IRAs into the new Retirement Savings Accounts. The conversion would be accomplished by paying income tax now on the amount currently in these accounts in exchange for having all withdrawals from the accounts be tax free in retirement. The tax that would be owed now on the converted funds could be paid in installments over the next four years.
The taxes paid on these conversions would boost revenues for the next four years, but at a large long-term cost. These tax payments would be borrowed from the future — they would represent payments that otherwise would have been made after people retired. Moreover, over the course of time, these conversions would result in net revenue losses, since people would elect to convert their traditional IRAs to Roth IRAs only if they expected to reduce their tax payments by doing so. In other words, people would pay tax now only if they concluded this would enable them to avoid larger amounts of tax in the future. The Urban Institute-Brookings Institution Tax Policy Center has found that this mechanism “effectively represent[s] borrowing from the future on very unfavorable terms.”[5]
Most states conform to the federal treatment of Individual Retirement Accounts or afford them treatment that is parallel to the federal treatment.[6] (This was not true in the earlier years of IRA policy, but over time states have conformed.) As these types of accounts — along with employer-based defined contribution plans — have become the dominant methods for saving for retirement, states have found it difficult to avoid conformity. Accordingly, this analysis assumes that all states will conform to these new provisions if they are enacted.
The proposed RSA/LSA policies would increase state revenue by approximately $6.7 billion in the first five years and decrease state revenue by a comparable amount in the second five years.[7] Although there would be no net cost over the first ten years, the long term cost would be substantial. The annual cost to states in 2016 would be $1.6 billion, and it ultimately could grow to a loss of as much as $4 billion a year.[8]
Employer-based Pension Changes
The Administration’s budget includes two sets of proposals that would make changes in employer-provided pension coverage — one set for defined contribution plans and the other set for defined benefit plans.
One proposal would consolidate the various kinds of employer-based savings plans such as 401(k), 403(b), 457(b), SIMPLE, and others into a single type of plan called Employer Retirement Savings Accounts (ERSAs). These accounts would be available to all employers and have a common set of rules. Because the common rules would allow greater deposits than is allowed under some of the current plans, there is a significant revenue loss over time. In addition, the budget proposes to make permanent the increased contribution limits for some of these plans and IRAs that were first enacted as temporary provisions in 2001. The state revenue loss from these provisions would come to about $5.7 billion over ten years.
The other proposal would strengthen funding for single-employer defined benefit plans over time. The specific provisions are complex, but in essence funding requirements would be increased relative to the benefits that the plans are projected to have to pay out. In addition, some of the ceilings on the amount of funding that employers could contribute each year would be increased. Despite requiring and encouraging higher employer contributions and thus increasing employer tax deductions for contributions, the President’s proposal shows that these provisions would increase revenue in the first two years after enactment. This is because the proposal allows use of more favorable interest rate assumptions for projecting future plan costs than are permitted under current law. As the requirements for higher funding levels are phased in, however, the contributions would grow relative to current law and the provision begins to lose revenue. The state revenue loss would be about $1.5 billion over ten years.
Versions of legislation to accomplish goals similar to those of the President’s proposal for defined benefit plans have been passed by the House and the Senate and are now in conference. The Congressional plans would be somewhat less expensive for states than the President’s budget proposal.[9]
Small Business Expensing
In 2003, the federal government temporarily expanded the amount of property, such as equipment, that small businesses can deduct in the year of purchase rather than depreciate over the property’s useful life. (This “expensing” provision is known as “Section 179”). Prior to 2003, small businesses could “expense” (or deduct in the year of purchase) $25,000 worth of property; the 2003 law increased that amount to $100,000, adjusted for inflation in years after 2003. The higher expensing amount is scheduled to expire at the end of 2007.
The President’s budget would raise the amount of property that could be expensed to $200,000 (adjusted for inflation after 2007) and make the higher amount permanent.[10]
Prior to the enactment of the 2003 expansion, all states except California followed the federal treatment of expensing for small businesses. When the higher expensing was enacted in 2003, some states “decoupled” from the federal provision and maintained the $25,000 limit. Currently, 34 states and the District of Columbia follow the federal rules now in effect; Arizona, Arkansas, California, Hawaii, Iowa, Kentucky, New Hampshire, New Jersey, Ohio, Rhode Island, and Wisconsin do not.
|
Methodology
To estimate the amount of potential revenue loss by state, assumptions must be made about which states would conform to which provisions. Some states automatically conform to most federal changes. Other states have to enact conformity measures but traditionally have done so after most federal tax-law changes. A few states are less tied to the federal system and conform only to certain types of changes.
For the purposes of this report, it is assumed that states that conform automatically and those that typically adopt conformity would generally conform to the new federal provisions, unless they have specifically avoided adopting a provision such as small business expensing or Health Savings Account treatment. The other provisions in the President’s budget that would cause large revenue losses are in the area of IRAs and pension treatment. Even states that generally do not conform to most aspects of federal law, such as Pennsylvania and New Jersey, do conform to federal treatment of Roth IRAs. It is assumed that all states would follow the federal lead on IRA and pension changes. (It is unclear how New Jersey might conform to the changes in employer-based defined contribution plans, since they only allow deductions for 401(k)s and not other plans; those losses are omitted for New Jersey.)
The specific state revenue loss estimates were made by beginning with the federal revenue loss, as estimated by the Office of Management and Budget, and then allocating that revenue loss to states. For provisions that solely or largely affect the individual income tax, the calculation was made as follows. The amount of the federal revenue loss first was distributed to the states based on the share of federal Adjusted Gross Income that is attributable to residents in that state. That amount was then divided by the ratio of the revenue raised by the state’s own individual income tax to the revenue raised by the federal individual income tax in that state. This second calculation helps adjust for each state’s tax rate and the breadth of its tax base. Finally, the result of this second calculation (which is the tentative state individual income tax loss before considering issues of conformity) was divided by the federal loss to determine a percentage of the total federal revenue loss applicable for each state. That percentage was applied for all federal changes that would affect the individual income tax in the state to determine the potential state revenue loss in the individual income tax. For provisions that primarily affect corporate income tax, the ratio of the state’s corporate tax revenue to total federal corporate tax revenue was used to distribute the proposed federal tax changes. Finally, for changes in depreciation, which affect both the individual and corporate taxes, a blended rate was used.
These revenue estimates should be considered approximations. For any given state, state revenue offices or legislative fiscal offices are likely to be able to provide more refined estimates. |
If the states that currently conform to the federal treatment continue to conform to the permanent allowance of increased expensing, the additional revenue loss for those states would be approximately $6.7 billion over ten years. This may be a low estimate of the impact; if expensing were made permanent some additional states would be likely to conform to avoid long-term differences between state and federal rules.
The Impact on States
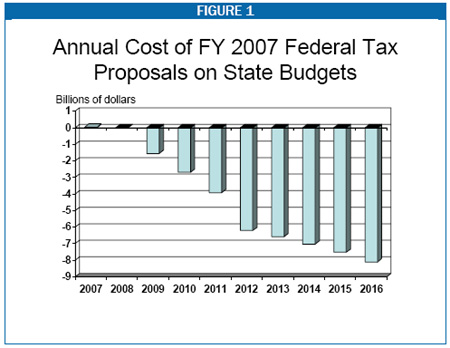
Taken together, the federal changes that affect states would result in an initial small revenue gain, with revenue losses beginning in the third year and growing progressively larger in subsequent years. By 2011, the revenue loss would be $3.9 billion a year. By 2016, it would be $8.1 billion a year. The costs would continue to rise in future years.
Over the first five years that the tax change would be in place, states would lose approximately $8 billion. That revenue loss would grow more than four-fold in the second five years, however, when the revenue loss would be $35 billion.
In a few states, the short-term revenue gain would be substantial. For example, California would gain almost $1 billion over the first four years and Wisconsin would gain $150 million. These initial gains could encourage states to conform to the revised federal law, even though there would be large long-term revenue losses. As noted above, the nature of the tax changes would make conformity likely in any case. The short-term gain simply adds to that likelihood, particularly with respect to the changed treatment of IRAs.
Conclusion
This analysis does not discuss the policy merits of the proposals in the President’s budget; it focuses solely on the relationship between federal tax changes and state revenues. Most states are in the difficult position of having their own ability to collect adequate revenues periodically buffeted by changes at the federal level. Yet federal policymakers rarely give consideration to ripple effects that federal tax changes can have on state revenues.
In some cases, it may be possible to make federal tax changes without affecting state revenues, if federal goals are accomplished by changing tax rates or providing tax credits rather than by changing the definition of taxable income. Where that is not possible and a federal tax change is warranted, other policies could be put in place to compensate states.
End Notes:
[1] To the extent possible, the potential revenue loss is adjusted to take into account the history and custom of each state with respect to conforming to the types of tax changes that the Administration’s budget proposes.
[2] California appears on the list of states with the largest ten-year losses but not on the list of the states with the largest five-year losses. This is because the report assumes that California will not conform to the new HSA incentives until the sixth year. See discussion below.
[3] For additional information on the problems HSA policy poses for both revenues and health coverage, see Jason Furman, Expansion in HSA Tax Breaks is Larger — and More Problematic — Than Previously Understood, February 4, 2006 https://www.cbpp.org/2-4-06tax.htm; Jonathan Gruber, The Cost and Coverage Impact of the President’s Health Insurance Budget Proposals, February 15, 2006 https://www.cbpp.org/2-15-06health.htm; and Edwin Park and Robert Greenstein, Administration Defense of Health Savings Accounts Rests on Misleading Use of Statistics, February 16, 2005 https://www.cbpp.org/2-16-06health.htm
[4] It should be noted that states might face other, indirect costs as a result of the proposed federal policies to promote and provide large tax advantages for HSAs. A recent study by noted M.I.T health economist Jonathan Gruber showed that the proposed HSA tax breaks would, on net, increase the number of uninsured by 600,000 persons, as the number of people becoming uninsured as a result of employer dropping would modestly exceed the number who gained insurance through taking up tax-subsidized high-deductible plans attached to HSAs. The expenses for caring for the newly uninsured would fall in part on state Medicaid programs and state- and locally-funded public hospitals and other public health care facilities.
[5] For additional information on RSA/LSA policy, see Robert Greenstein and Joel Friedman, President’s Savings Proposals Likely to Swell Long-term Deficits, Reduce National Savings, and Primarily Benefit Those with Substantial Wealth, CBPP, May 25, 2005. https://www.cbpp.org/1-20-04tax.pdf
[6] Two states that typically use their own tax rules, New Jersey and Pennsylvania, nevertheless generally conform to Roth IRA treatment. They do not, however, allow deductions for traditional IRAs.
[7] New Jersey and Pennsylvania do not allow deductions for traditional IRAs, so they would not gain revenue through these rollover provisions.
[8] The ability of people to save through RSAs and LSAs could pose another problem for states and localities. Individuals could contribute up to $5,000 to each type of account, and up to $5,000 to the LSAs of each family member. Thus, a family of four with two earners could put $10,000 in RSAs and $20,000 into LSAs each year. This would provide a tax free savings method that would compete with tax-free state and local bonds, which are currently the only tax-free savings vehicle that can be used by people at all income levels. This could force state and local governments to pay higher interest rates to attract sufficient investment in their bonds.
[9] H.R. 2830 and S. 1783
[10] Under current law, the $100,000 is reduced by the amount by which the cost of qualifying property exceeds $400,000. Under the President’s proposal, the $200,000 would be reduced by the amount that the cost of qualifying property exceeds $800,000. |