
HUD’S RELIANCE ON RENT TRENDS FOR HIGH-END
APARTMENTS
TO CRITICIZE THE HOUSING VOUCHER PROGRAM IS MISTAKEN
Data HUD Cites from a Recent New York Times Article Do Not Support
HUD’s Contention that the Rent-Setting Mechanism in the Voucher Program is
Flawed
|
PDF of this
report
Related Reports: |
| If you cannot access the files through the links, right-click on the underlined text, click "Save Link As," download to your directory, and open the document in Adobe Acrobat Reader. |
The Administration’s fiscal year 2005 budget requests an appropriation for the Section 8 housing voucher program that is $1 billion less than Congress appropriated in fiscal year 2004 and more than $1.6 billion — or about 12 percent — less than would be needed to maintain services at their current level. The cuts then rise to about $4.6 billion by fiscal year 2009.[1]
HUD officials claim these funding cuts will not lead to a reduction in the number of families served because the budget also proposes to convert the voucher program to a block grant (labeled the “Flexible Voucher Program”) and give local housing agencies greater discretion to set program policies, including the maximum subsidy levels for apartments that voucher-holders occupy. They claim that local housing agencies are better positioned than HUD to set maximum subsidy levels and that the increased flexibility provided under the Administration’s proposal will cause per-unit costs to drop. To support this assertion, they point to data in a November 29, 2003 New York Times article showing that market rents declined in ten metropolitan areas between 2002 and 2003. HUD asserts that rents in the Section 8 housing voucher program increased in each of these areas over the same time period.
The data HUD cites do not support its contentions. In brief:
- The data in the New York Times article are for high-end apartments rather than the low-cost market segment accessible to households with housing vouchers; and
- Housing agencies already have flexibility to set local subsidy standards based on local market conditions.
Following a discussion of each of these points, this analysis briefly explains why the Administration’s proposals are not needed to control voucher program costs. Specifically:
- While rental costs in the overall rental market are still rising, the annual rate of growth has slowed significantly. This, in turn, will slow the annual rate of growth of Section 8 voucher subsidy costs;
- The housing voucher program already has cost-control mechanisms in place; and
- To the extent that further cost control is desired, there are better ways to reduce costs than to convert the program to a block grant.
HUD’s Reliance on the Times Data is Misplaced
The Data in the Times
Article Are for High-End Apartments,
Not for the Segment of the Market
Accessible to Voucher-Holders
In relying on the Times data to criticize the housing voucher program, HUD is comparing apples and oranges. The Times article cites data for Class A apartments from the National Real Estate Index. These are high-end apartments, constructed or substantially rehabilitated in the last 15 years, which typically include a pool, tennis courts, and/or health/fitness rooms. These are not the modest apartments that are accessible to families with Section 8 housing vouchers.
Rents for the high-end apartments discussed in the Times article do not follow the same pattern as rents for low-cost apartments accessible to families using housing vouchers. Figure 1 provides a graphic illustration of the unique rent trends applicable to high-end apartments. The dotted line shows the annual rate of change in rents for professionally-managed apartments, as measured each quarter by M/PF Research, Inc. These are high-end (or near-high-end) apartment properties owned or operated by the nation’s largest apartment owners and management companies. The solid line, by contrast, shows the annual rate of change in rents for the overall rental stock, as measured by the rent component of the Consumer Price Index.[2] These two lines depict very different rent trends.
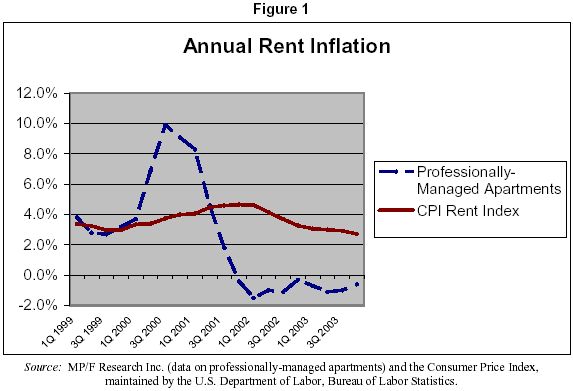
As shown in Figure 1, the annual rate of change of rents for professionally-managed apartments was quite volatile between 1999 and 2003, rising as high as 10 percent in the third quarter of 2000 and then falling into negative territory by the first quarter of 2001, where it remained throughout 2002 and 2003. The overall rental market measured by the CPI rent index, by contrast, has been much more stable, with an annual rate of change between 2.7 percent and 4.7 percent throughout this period. While the annual rate of growth of rents in the overall rental market has slowed in recent years, it has still remained positive, in stark contrast to the decline in rents in the professionally-managed sector.
As the Times article explains, the decline in rents of high-end apartments in certain cities is due in significant part to the overbuilding of such rental units. “There is just too much construction. There are too many units coming onto the market” economist Gleb Nechayev of Torto Wheaton told the Times. By contrast, in many areas of the country, there has been a loss of units affordable to low-income families. As the Joint Center for Housing Studies of Harvard University notes in The State of the Nation’s Housing 2003: “The new multifamily apartments being built are substantially more expensive on average than the ones being lost. This trend . . . threatens to leave the nation with a dwindling supply of modest rentals.” Data from a 2001 Census Bureau survey (this is the most recent year for which these data are available) show that the vacancy rate for the least-expensive 40 percent of apartments — those most likely to be affordable to families with vouchers — was well below the vacancy rate for high-end apartments.[3]
Housing Agencies Already Have Flexibility to Set Local Subsidy Standards
Another problem with HUD’s argument is that it fails to recognize that local housing agencies already have significant flexibility to adjust housing voucher subsidy standards to meet local market conditions. Using census data and regional and local rent surveys designed to estimate market rents for modest apartments of decent quality, HUD develops a “Fair Market Rent” (FMR) for each metropolitan area and non-metropolitan county. Local housing agencies then adjust the FMR to meet local market conditions, setting a subsidy standard called the voucher payment standard. (Families typically pay 30 percent of their income for rent, with the housing agency providing a subsidy covering the difference between the family’s payment and the lower of the voucher payment standard or the actual rent.) Local housing agencies can set their payment standards between 90 and 110 percent of the FMR without HUD approval and can set higher or lower payment standards if they meet certain criteria designed to prevent subsidy costs from getting out of control (or on the other end, from being so low they shift too much of the costs to residents). As is discussed below, housing agencies already have incentives to ensure that voucher rents are at a reasonable level, and the evidence shows that the average rent for units rented by voucher holders is below the average rent charged for comparable units rented to non-voucher holders.
HUD’s Proposals Are Not Needed to Control Costs
As explained more fully in the other CBPP analyses cited throughout this paper, HUD’s proposal to convert the voucher program to a block grant and substantially cut its funding is deeply flawed. For the reasons summarized below, it also is unnecessary.
CBO Projects that Growth in
Housing Voucher Costs Will Slow
Without Cuts or Program Changes
As shown in Figure 1, the annual growth in rents for the rental market as a whole has slowed in recent years. As housing agencies adjust their payment standards and HUD updates the FMRs in light of the new rent data, the growth of voucher program costs will slow accordingly. The recovery of the economy also is expected to slow the growth of housing voucher costs by leading to increases in the earnings of low-income families and thus reductions in the amount of subsidy needed to help them afford their housing costs. (All else being equal, the average difference between 30 percent of household income and rental charges — i.e. the average voucher subsidy amount — rises more rapidly in economic downturns as income falls, and rises more slowly in recoveries, as incomes rebound.)
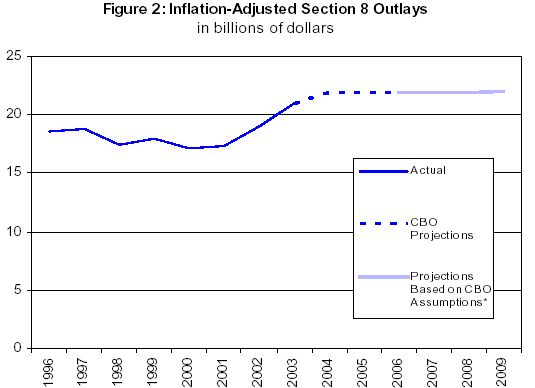
The Congressional Budget Office estimates that the average cost of a housing voucher will rise only 2.9 percent in fiscal year 2005, well below the rate of increase in recent years. CBO projects that overall spending under the Section 8 program, which includes both the housing voucher program and a separate project-based housing assistance program, will grow by only 1.8 percent in 2005. As Figure 2 shows, when inflation is taken into account, overall spending on vouchers is expected to be nearly flat in the coming years.[4]
Cost-Control Mechanisms are Already in Place
Under current law, each housing agency is required to compare the rent for every apartment leased by a voucher holder to market rents for similar units in similar locations and must refuse to make payments on vouchers where the rent is out of line with the local market. In 2001, a study conducted for HUD took the first systematic look at implementation of these requirements by local housing agencies. The study found that, on the whole, the requirements were being followed, and that the average rent of units occupied by families with housing vouchers was $95 less than the estimated rents for comparable unassisted units. More specifically, the study found that housing voucher units “in relatively high cost submarkets almost universally have rents less than comparable rents. Overall, such units rent for $244 less than comparable rents. Only 3 percent of such units have rents that exceed market rent by 5 percent or more. By contrast, rents in relatively low cost submarkets are, on average … just $14 less than comparable rent."
Housing agencies also have strong local political pressures to keep costs reasonable. To the extent the voucher program is paying above-market rents, landlords will prefer voucher-holders over unassisted households, a situation that would lead to substantial local political opposition to the voucher program because it places unassisted households at a disadvantage.
There are Better Ways to Control Costs
Rather than convert the voucher program to a block grant, a better way for HUD to control costs would be to work within the current system to ensure that FMRs are as accurate and up-to-date as possible. This would help ensure that housing agencies are provided with the best possible guidance regarding appropriate rent levels for low-costs apartments in each market. In this regard, it is noteworthy that HUD requested and received additional funds in fiscal year 2003 to improve the accuracy of FMRs by increasing the number of local rent surveys used to calculate them. However, it appears that HUD has not spent the funds appropriated for this purpose. As HUD also received additional funds for this purpose in fiscal year 2004, HUD now has both the funds and the means to make the voucher-program more efficient and effective.
Other possibilities for helping to reduce per-unit costs within the current system include:
- Awarding administrative bonuses for local housing agencies that succeed in keeping costs low without compromising families’ access to quality housing or increasing their rent burdens;
- Alternatively, such local housing agencies could be allowed to increase the number of families they serve;
- Conducting research on low-cost strategies for helping families with their housing search, such as transportation assistance, apartment locator services, and expanded landlord outreach. Anecdotal evidence suggests that such strategies can help families access more units below any given rent level. If confirmed by research, the dissemination of this information could show housing agencies how a modest, up-front cost could keep ongoing subsidy costs low, saving the government money over the long run.
End Notes: