
DIGGING THE HOLE
DEEPER:
The Senate Plan
Substantially Increases Deficits
By
|
PDF of report Related Report: Budget Priorities Under the Senate Budget Plan |
|
| If you cannot access the files through the links, right-click on the underlined text, click "Save Link As," download to your directory, and open the document in Adobe Acrobat Reader. |
| NOTE: The analysis in this report examines the budget resolution as approved by the Senate. An amendment offered by Senator Feingold and approved on the Senate floor would impose a 60-vote point of order against all of the tax cuts in the resolution unless they were accompanied by offsetting tax increases or entitlement cuts. If included in the final conference agreement, this “pay-as-you-go” rule could have a significant impact on the degree to which tax cuts assumed in the Senate budget actually are enacted in a form that increases the deficit. News reports indicate, however, that the House Republican Leadership and the White House strongly oppose this “pay-as-you-go” rule and will push for its removal in conference. Our analysis reflects the Senate plan without the Feingold amendment. |
The Senate approved a budget plan on March 12, 2004, that would cause deficits in coming years to be larger than they otherwise would be. True, under the plan, deficits would decline by 2009 from their current, very high levels. But in the absence of the Senate Budget Committee plan, deficits would decline further and more rapidly.
As the graph and Table 1 show, the deficits under the Senate plan are larger than the deficits that CBO projects under current law. The CBO projections, known as the CBO “baseline,” are calculated by assuming that tax and entitlement law will remain unchanged and that funding for annually appropriated (“discretionary”) programs will grow with inflation.
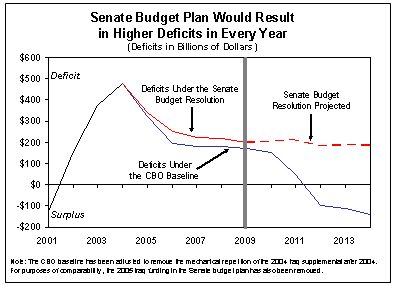
- The Senate plan would raise projected deficits above the CBO baseline levels by significant amounts in each of the next five years — and by a total of $178 billion over the five-year period.[1]
- Over the next ten years, the Senate plan increases deficits by $1.3 trillion, relative to the CBO baseline.[2]
- As Table 1 demonstrates, tax cuts account for the lion’s share of the increase. (The plan contains defense spending increases and domestic spending cuts that roughly offset each other; see Table 2.) The tax cuts include not just the extension of several middle-class tax cuts but making permanent nearly all of the tax-cut measures enacted in 2001 and 2003, including estate tax repeal, capital gains and dividend tax cuts, and reductions in the top income tax rates. The bulk of the cost over ten years lies in these upper-income provisions.
Table 1
How
the Senate Budget Committee Plan Increases Deficits
(in
billions of dollars)
|
|
2005 |
2006 |
2007 |
2008 |
2009 |
5-year total |
10-year total |
|
| Deficits in CBO Baseline(1).................. |
323 |
197 |
182 |
183 |
170 |
1,055 |
905 |
|
| Senate Budget Committee Plan: |
|
|
|
|
|
|
|
|
| Tax cuts............................................ |
24 |
39 |
25 |
23 |
28 |
138 |
1,132 |
|
| Spending changes(2).......................... |
-6 |
15 |
11 |
4 |
-6 |
19 |
-1 |
|
| Total policy changes......................... |
18 |
54 |
36 |
27 |
22 |
157 |
1,131 |
|
| Interest on policy changes................ |
0 |
2 |
4 |
6 |
8 |
21 |
171 |
|
| Increase in deficits......…................ |
18 |
56 |
41 |
34 |
30 |
178 |
1,301 |
|
|
|
|
|
|
|
|
|
||
| Resulting deficits under Senate plan |
341 |
253 |
223 |
217 |
200 |
1,234 |
2,206 |
|
|
Totals may not add due to
rounding. |
||||||||
Some 86 percent of the $1.3 trillion increase in deficits over years would occur in the second five years, from 2010 to 2014. It is especially dangerous to be increasing deficits in those years, as they are the years in which the retirement of the baby-boom generation will begin to cause faster growth in Social Security and Medicare costs.
Table 2 provides further detail on the spending changes in the Senate plan, which includes large increases in defense, homeland security, and international affairs programs and large reductions in domestic discretionary programs.
Table 2
Spending Changes in Senate Plan
(in billions of dollars)
|
|
2005 |
2006 |
2007 |
2008 |
2009 |
5-year total |
10-year total |
|
|
Defense, international, and homeland security increases (1).......................... |
14 |
27 |
29 |
29 |
30 |
129 |
270 |
|
|
Refundable tax credits........................... |
* |
5 |
4 |
4 |
4 |
18 |
64 |
|
|
Domestic appropriations cuts................ |
-18 |
-13 |
-17 |
-24 |
-32 |
-105 |
-281 |
|
|
Entitlement reductions........................... |
-2 |
-4 |
-5 |
-5 |
-8 |
-24 |
-54 |
|
|
Total spending changes....................... |
-6 |
15 |
11 |
4 |
-6 |
19 |
-1 |
|
| Totals may not add due to
rounding. (1) Excludes expenditures for the $30 billion held in reserve for a 2005 supplemental for operations in Iraq. |
||||||||
Figures Likely to Understate Deficits
The figures cited above likely understate the level of deficits under the plan. Like the President’s budget, the Senate plan extends relief from the Alternative Minimum Tax for only one year. No observer believes that either the President or Congress will allow such relief to expire after 2005, however, as that would cause the number of taxpayers subject to the AMT to jump from three million today to 21 million in 2006, nearly 30 million by 2009, and 44 million by 2014. Virtually all knowledgeable observers expect AMT relief to be continued. Senior Administration officers have said they expect such a proposal to be included in next year’s budget.
The omission from the Senate plan of the costs of continuing AMT relief after 2005 is essentially a gimmick, making the deficits look lower than if such relief were reflected in the plan. Table 3 (on the following page) shows CBO’s estimate of the cost of continuing AMT relief after 2005. If these costs were reflected in the Senate plan, the plan’s deficits would be $149 billion higher over five years and $672 billion higher over ten years than reflected in the plan. Over ten years, deficits under the plan, including AMT relief, would total $2.9 trillion.
The deficit numbers also exclude the continued cost of operations in Iraq after 2005. Unlike the President’s Budget, which failed to show costs for Iraq after this year, the Senate has more responsibly included a $30 billion “reserve fund” to cover the 2005 cost of operations in Iraq and Afghanistan. (The Defense Department says that the supplemental funding it will request may cost as much as $50 billion.) Nevertheless, the $30 billion reserve fund for 2005 — which adds $36 billion to deficits over five years and $46 billion over ten years, when the associated interest costs are included — likely understates how much operations in Iraq will add to future deficits, because it reflects no costs for operations in Iraq after 2005.
Table 3
Suppose the Budget Plan Also Reflected Relief from the Alternative Minimum Tax?
(in billions of
dollars)
|
2005 |
2006 |
2007 |
2008 |
2009 |
5-year total |
10-year total |
||
| Deficits under Senate plan(1)…………. |
341 |
253 |
223 |
217 |
200 |
1,234 |
2,206 |
|
| Cost of AMT relief omitted from the Senate plan, including interest(2)……… |
|
13 |
35 |
45 |
57 |
149 |
672 |
|
| Deficits in Senate plan, with AMT…… |
341 |
265 |
258 |
262 |
258 |
1,383 |
2,878 |
|
| (1) Excludes expenditures for
the $30 billion held in reserve in 2005 for operations in Iraq. (2) CBO estimate of the cost of indexing the AMT and extending the treatment of non-refundable personal credits. | ||||||||
In summary, although deficits will fall between 2004 and 2009 under the Senate plan, the decline is not because of the plan but in spite of it. The deficit decline is due to recovery from the recession. In the absence of the policies contained in the Senate plan, deficits would fall substantially more. While some of the costs in the Senate plan may be inevitable, many are not, and all could be offset. The effect of the plan is to increase deficits above what they otherwise would be.
End Notes:
[1] The CBO baseline has been adjusted to treat the $87 billion fiscal year 2004 Iraq supplemental as a one-time event, removing the mechanical repetition in the baseline of this $87 billion every year after 2004. To be comparable with the CBO baseline, the spending and deficit numbers in the Senate plan have been adjusted to remove the $30 billion fiscal year 2005 supplemental for operations in Iraq that is included in the plan.
[2] The ten-year figures in these tables reflect CBO’s estimates of the cost in 2010-2014 of extending the tax cuts as the Senate plan calls for. These figures also reflect an assumption that the entitlement cuts under the plan would remain constant at $6 billion a year after 2009; this is the average entitlement cut under the plan in 2007-2009. Finally, the 10-year figures reflect the assumption that discretionary spending under the plan would grow with inflation after 2009.