Revised November
18, 2002
Revised November
18, 2002
The
State Tax Cuts of the 1990s, the Current Revenue Crisis,
and Implications for State Services
by Nicholas Johnson
Summary
|
PDF
of this report
Additional Analyses
|
|
|
| If you cannot access
the files through the links, right-click on the underlined text, click "Save Link
As," download to your directory, and open the document in Adobe Acrobat Reader. |
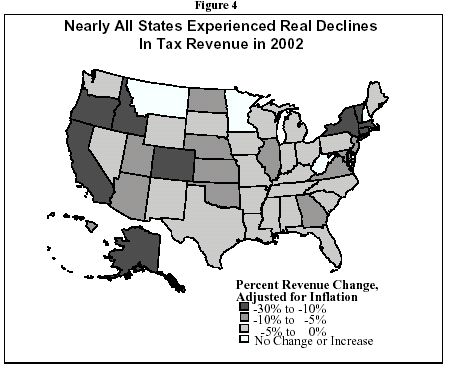
States now face a gigantic revenue problem. Total state tax revenue in
fiscal year 2002 was some $38 billion lower than it was in the previous year
after adjusting for inflation. Some 45 states lost revenue. Official
forecasts released to date suggest that state revenues at best will hold steady
after adjusting for inflation in fiscal year 2003, meaning that none of that $38
billion is likely to be recouped this year. Indeed, the revenue hole could
get even deeper.
These revenue problems are taking a
substantial toll on the services provided by state governments. Many states,
for instance, are reducing health insurance benefits or eligibility for
low-income families, or are increasing the amount that poor families must pay to
access health insurance. Many states are reducing eligibility for child-care
subsidies for working families; many are raising tuition for students at public
colleges and universities. And further such cuts are likely to occur as states
exhaust their rainy day funds and other one-time mechanisms for shoring up
budgets.
The revenue problems that states now
face contrast sharply with the situation in the recent past.
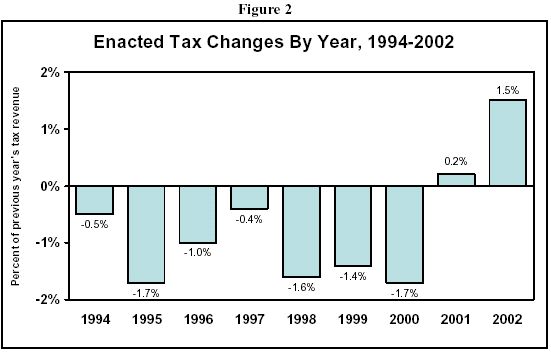
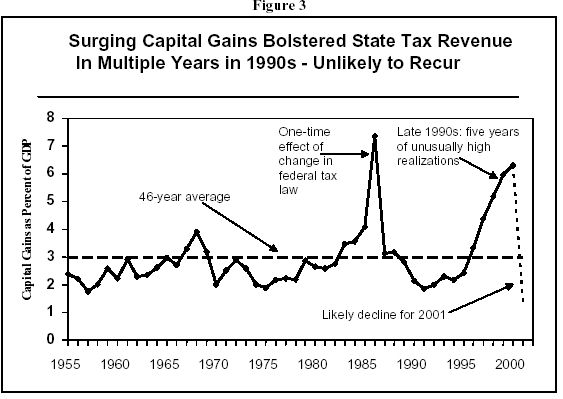
- In the mid- to late-1990s and into
2000 and 2001, revenue collections grew substantially as a result of unusually
high — as it turned out, unsustainably high — levels of economic activity,
particularly personal consumption and capital gains realizations. These revenue
windfalls turned out to be temporary, as capital gains have declined
dramatically, and the growth in personal consumption as a share of income is
unlikely to be sustainable.
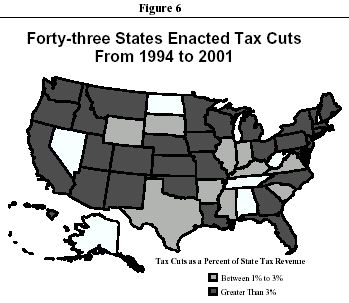
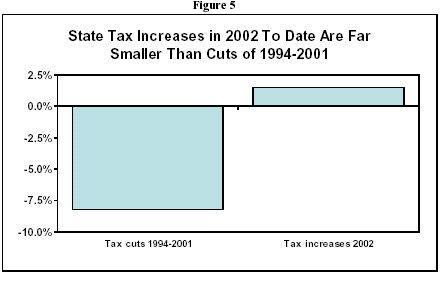
- Many states used those temporary
levels of revenue growth to finance largely permanent tax cuts. Based on
revenue forecasts that assumed revenue growth would continue at or near the
levels of the late 1990s, some 43 states enacted large tax cuts in 1994 through
2001. These tax cuts, net of a few tax increases enacted in those years,
reduced revenue by some 8.2 percent of state tax revenue nationwide. The
ongoing loss of state tax revenue resulting from the net tax cuts enacted from
1994 to 2001 is more than $40 billion per year.
- Not
surprisingly, states that enacted very large tax cuts in the 1990s are in the
biggest fiscal trouble now. For instance, the ten states with the largest tax
cuts in the 1990s faced a median budget gap in 2002 equal to nine percent of
state spending,
and a 13 percent gap in 2003. By contrast, the ten states that cut taxes the
least in the 1990s had a median budget gap in 2002 equal to five percent of
state spending and a one percent gap in 2003.
The scale of the
current fiscal downturn was not necessarily predictable, although states should
have known the good times would not last forever. It is relatively unusual for
a recession and a sharp stock market decline, the two most proximate causes of
the fiscal crisis, to occur at the same time. Moreover, to avoid tax cuts
entirely in the 1990s arguably would have been politically difficult for states,
given the large scale of the revenue windfalls. Now that the economic activity
that led to those windfalls has proven unsustainable, however, states should be
reconsidering those tax cuts and in many cases ending them or enacting
equivalent tax increases.
Yet with very few exceptions, the tax cuts
enacted in 1994 through 2001 that are costing states over $40 billion per year
remain in place. States have reversed almost none of those tax cuts.
Nor, in general, have they enacted other tax increases to take their place.
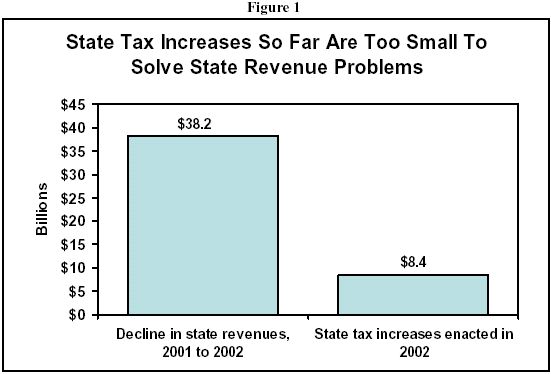
- The net tax increases enacted to date
in 2002 will raise just $8.4 billion per year, an amount equal to about 1.5
percent of total state tax collections.
- That amount, $8.4 billion, is
sufficient to replace only about one-fifth of the immediate decline in revenue
that is causing states’ present fiscal problems.
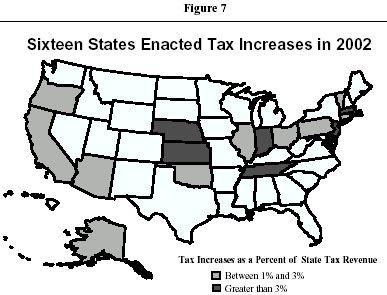
- Just 16 states have passed significant
net tax increases, that is, measures that increase revenue by one percent or
more.
In six of those 16 states — Indiana, Kansas, Massachusetts, Nebraska, New Jersey
and Tennessee — the tax increase exceeded three percent of state tax revenue.
In another ten of those 16 states, the tax increase was between one percent and
three percent of tax revenue.
- Another five states passed significant
tax increases while allowing significant tax cuts enacted in previous years to
take effect. In each of these states, Hawaii, Maryland, Michigan, New York and
Rhode Island, a cigarette tax increase was largely or entirely offset by a
personal income tax reduction (along with reductions in corporate taxes in New
York and vehicle excise taxes in Rhode Island). The combined effect of the tax
increases and tax cuts was to do relatively little to raise net tax revenue in
those states.
- The remaining 29 states have enacted
no significant net tax increases in 2002.
The failure of states
to act affirmatively to confront their revenue problems stands in contrast to
their actions in previous economic downturns. Recessions nearly always reduce
state government revenues, and as a result states typically cut spending and
also raise taxes to balance their budgets. This was true in the wake of the
1990-91 recession, when some 44 states raised taxes along with reducing
spending. By contrast, only a few states have raised taxes since the recent
recession began in 2001.
Moreover, widely
acknowledged structural problems with state budgets are likely to preclude
substantial growth in state tax bases even when the economy
enters a full recovery, whenever that might be. For instance, state sales taxes
bases are gradually eroding as the economy moves from (taxed) goods to (untaxed)
services. Most states are suffering from increasing activity by corporations to
exploit loopholes in state corporate income tax systems. And states do not make
as much use as they could of the personal income tax, which is the
broadest-based tax and the one tax with the potential to offset the decline of
those other taxes in the long term.
To the extent that they
have made any tax changes, states in 2002 have largely perpetuated, and in some
cases exacerbated, these underlying flaws in state revenue structures.
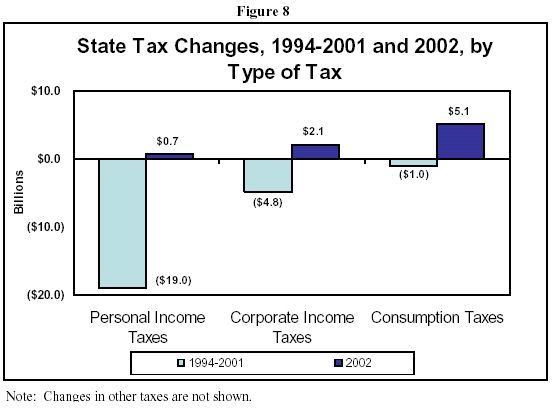
- Increases in consumption taxes —
cigarette, general sales, alcohol and gasoline taxes —represent the great
majority of the tax increases of 2002, representing $5.1 billion or 60 percent
of the total.
Cigarette taxes are by
far the leading type of tax increase enacted in 2002, accounting for about $3.4
billion or 41 percent of the new tax revenue. Cigarette consumption is
declining, and tax increases accelerate that decline, so that while
these tax increases bring in more revenue in the short term, the new revenues
decline over time. Sales tax changes — mostly flat rate increases — account for
another $1.5 billion or 18 percent of the total net tax increases. The revenues
raised by these taxes as well, although important in the short run, fail to grow
with the economy, with the likely result of future budget shortfalls.
|
Table 1
Notable State Tax Increases
in 2002
|
|
States
with major tax increases (net greater than three percent of state tax
revenues): |
|
Indiana |
Sales tax rate increase, cigarette tax increase, gasoline
tax increase, increased gambling taxes, utility tax increase |
|
Kansas |
Sales tax rate increase, business tax increase, gasoline
tax increase, cigarette tax increase, inheritance tax increase |
|
Massachusetts |
Income tax increases (including capital gains tax
increase, personal exemption reduction, and elimination of charitable
deduction), cigarette tax increase |
|
Nebraska |
Income tax rate increase, cigarette tax increase, sales
tax rate increase and base expansion |
|
New Jersey |
Corporate income tax increase, cigarette tax increase |
|
Tennessee |
Sales tax rate increase, corporate tax increase,
cigarette tax increase, alcohol tax increase |
|
States
with smaller but still significant tax increases (net between one percent
and three percent of state tax revenues): |
|
Alaska |
Alcohol tax increase |
|
Arizona |
Cigarette tax increase |
|
California |
Suspend corporate net operating loss deduction |
|
Connecticut |
Limit corporate tax credits, increase gasoline and
cigarette taxes |
|
Illinois |
Cigarette and gambling tax increases |
|
Ohio |
Income tax increase on trusts, cigarette tax increase |
|
Oklahoma |
Income tax rate increase (triggered automatically under
pre-existing statute) |
|
Oregon |
Cigarette tax increase |
|
Pennsylvania |
Cigarette tax increase |
|
Vermont |
Cigarette tax increase |
|
States
with combination of significant tax increases and tax cuts (net impact less
than 1 percent of state tax revenue): |
|
Hawaii |
Cigarette tax increase; continued phase-in of personal
income tax cut |
|
Maryland |
Cigarette tax increase; continued phase-in of personal
income tax cut |
|
Michigan |
Cigarette tax increase; continued phase-in of personal
income tax cut |
|
New York |
Cigarette tax increase; continued phase-in of corporate
and personal income tax cuts |
|
Rhode Island |
Cigarette tax increase; continued phase-in of cuts to
personal income tax and vehicle excise tax |
|
Note: Excludes postponed tax cuts, fee hikes and
some other revenue measures; see Appendix. |
- By contrast, personal income taxes —
the most broad-based form of tax and therefore the tax most likely to grow with
the economy and to distribute burdens fairly across the income spectrum —
account for just $700 million or 9 percent of the total net tax increases.
- Corporate income tax increases account
for $2.1 billion or 25 percent of the total net tax increases. Much of that
expected revenue comes from just one state, California, which expects to raise
$1.2 billion this year by reducing corporations’ ability to deduct past years’
operating losses. Unfortunately for the long-term revenue picture in
California, the increase is structured to allow corporations to reclaim the
additional taxes they have paid beginning three years from now, and even gain an
additional tax break, meaning that there is a long-term revenue loss rather than
a gain.
On
the positive side, a few states in the last year not only raised new revenues,
but included in their packages measures that respond to these structural flaws.
These revenue actions provide possible models for other states to consider as
alternatives to budget cuts.
- Massachusetts and Oklahoma reversed some income tax cuts that were enacted in
the 1990s. They were two of 21 states from 1994 to 2001 that cut top income tax
rates, actions which in retrospect were unsustainable. The remaining 19 states
similarly could reverse those rate reductions in whole or in part to raise new
revenue. Nebraska and (in 2001) North Carolina imposed temporary income tax
surcharges. Louisiana voters in November raised income taxes to pay for a sales
tax reduction, a change which is revenue-neutral in the short run but which will
help the tax system keep pace with economic growth in the longer term.
- New Jersey sharply reduced the number of
corporations that are able to manipulate tax laws to avoid paying any
corporate income tax at all. Although state corporate income taxes have
been declining as a revenue source over time, states can stem this decline by
closing loopholes and by creating alternative tax bases that ensure that
profitable corporations pay at least some tax in states where they do
business. The New Jersey increase represents the most significant
attempt to do so by any state this year, although other states are considering
comparable action.
- Nebraska raised substantial new sales
tax revenue in 2002 by broadening its sales tax base to include more services.
Most states exempt many services from their sales taxes. With the service
sector of the economy continuing to grow, base expansions like Nebraska’s are
important for future revenue stability.
At a minimum, states can protect existing revenue sources. For instance,
some 16 states have protected their estate tax revenue by “decoupling” from the
federal estate tax changes, and 30 states have protected their corporate income
taxes by decoupling from changes in federal depreciation rules. (See box
below.) Several other states, such as Connecticut, Florida, and
Michigan, have postponed at least some tax cuts that were originally enacted
before the recession and stock market decline made them unaffordable.
Prelude to Crisis: The Tax Cuts of 1994-2001
From 1994 to 2001, nearly every state
cut taxes and most of the tax cuts were substantial. In 43 states, net tax cuts
exceeded one percent of total state revenue, and most were much larger
than one percent. Aggregate net state tax reductions from 1994 to 2001 equaled
about 8.2 percent of state tax revenues. These cuts were permanent. In other
words, annual state tax revenue today is about 8.2 percent — or more than $40
billion — lower than it would be had those 43 states not cut taxes during that
time.
At
the time they were enacted, the large tax cuts of 1994-2001 may have appeared
affordable in many states because tax revenues were coming in at levels above
expectations and many states were running record surpluses. Those
higher-than-expected tax revenues were due to a variety of factors. Capital
gains realizations were at all-time highs for several years in a row because of
the remarkable increase in the stock market, boosting income taxes. The stock
market increase coupled with a run-up in consumer debt also fueled a dramatic
increase in personal consumption, from less than 90 percent of disposable
personal income in the early 1990s to about 95 percent by decade’s end, boosting
sales tax revenue. Corporate profits were also high. With this unusually high
and rapidly growing revenue stream, states could cut taxes while maintaining
spending growth at about the same level as in previous decades and also
accumulating rainy day funds that, although insufficient to weather the current
fiscal crisis, were quite large by historic standards.
Unfortunately, to a
large extent the trends that underlay the tax cuts of the 1990s have turned out
to be unsustainable. Capital gains realizations, following the decline of the
stock market, have dropped substantially. While it is widely expected that
capital gains will return to their long-term historical level of about three
percent of GDP once the economy recovers, few if any economists would forecast a
return to the level of capital gains realizations of the late 1990s, which
reached 6 percent of GDP. Personal consumption as a share of income has
leveled off and even declined a bit to 93 percent in the most recent quarter,
although it has not yet returned to the sub-90 percent range in which it
generally rested from the 1960s through the early 1990s.
In other words, the tax cuts of the 1990s were financed largely by temporary
economic conditions that have now ceased. But the tax cuts themselves were
designed to be permanent. At present, nearly all of those tax cuts
remain in place.
Only a minority of states have been willing to reclaim even a small portion of
that revenue.
The Fiscal Crisis of 2002: State Revenue
Responses
In fiscal year 2002, the temporary economic
conditions that financed the tax cuts of the 1990s came to an end. States
in fiscal year 2002 collected about $38 billion less in taxes than in the
previous year, after adjusting for inflation. That decline equals close to
8 percent of total state tax revenue. Making further adjustments for
population growth and the impact of net tax increases
that took effect in 2002, the decline equals $44 billion or about 9 percent of
total state revenue.
(See Table 2.)
Table 2
State Tax Collections Changes,
FY 2001 to FY 2002 (July-June period)
(adjusted for inflation)
|
State |
Change
in Tax Collections
|
|
State |
Change
in Tax Collections
|
|
State |
Change
in Tax Collections
|
|
Alabama |
-2.1% |
|
Louisiana |
-0.3% |
|
Ohio |
-2.9% |
|
Alaska |
-29.3% |
|
Maine |
-4.5% |
|
Oklahoma |
-6.7% |
|
Arizona |
-7.8% |
|
Maryland |
-6.3% |
|
Oregon |
-21.7% |
|
Arkansas |
-2.4% |
|
Massachusetts |
-13.5% |
|
Pennsylvania |
-4.3% |
|
California |
-19.1% |
|
Michigan |
-4.2% |
|
Rhode Island |
-7.6% |
|
Colorado |
-11.7% |
|
Minnesota |
2.8% |
|
South Carolina |
-4.8% |
|
Connecticut |
-12.5% |
|
Mississippi |
-2.3% |
|
South Dakota |
-2.1% |
|
Delaware |
2.0% |
|
Missouri |
-2.1% |
|
Tennessee |
-4.2% |
|
Florida |
-0.7% |
|
Montana |
0.5% |
|
Texas |
-3.3% |
|
Georgia |
-6.4% |
|
Nebraska |
-5.4% |
|
Utah |
-5.5% |
|
Hawaii |
-5.2% |
|
Nevada |
-0.3% |
|
Vermont |
-11.3% |
|
Idaho |
-11.8% |
|
New Hampshire |
3.7% |
|
Virginia |
-5.6% |
|
Illinois |
-5.4% |
|
New Jersey |
-9.3% |
|
Washington |
-3.3% |
|
Indiana |
-3.4% |
|
New Mexico |
-2.7% |
|
West Virginia |
1.9% |
|
Iowa |
-4.1% |
|
New York |
-12.6% |
|
Wisconsin |
-2.5% |
|
Kansas |
-7.8% |
|
North Carolina |
-2.3% |
|
Wyoming |
-1.8% |
|
Kentucky |
-2.6% |
|
North Dakota |
-6.1% |
|
50 states |
-7.9% |
|
Source: Center on Budget and Policy Priorities
calculations from Rockefeller Institute of Government data. |
As a result of these
revenue declines, the National Conference of State Legislatures reports that 45
states in fiscal years 2002 and/or 2003 faced budget gaps equal to at least one
percent of general fund spending. Some 33 states faced gaps equal to at least
five percent of spending.
Compared with the size
of the problem, the tax increases of 2002 have been quite modest in scope.
- States in 2002 have enacted net tax increases
totaling $8.4 billion per year, an amount equal to about 1.5 percent of
states’ total tax collections in the previous fiscal year.
- The $8.4 billion in tax increases will
be sufficient to fill only about one-fifth of the real revenue decline that has
occurred since fiscal year 2001.
- Although nearly every state faces
substantial budget problems, just 16 states have passed significant net tax
increases, that is, measures that increase taxpayers’ liability by one percent
or more.
In six states — Indiana, Kansas, Massachusetts, Nebraska, New Jersey and
Tennessee — the tax increase exceeded three percent of state tax revenue. In
another ten states, the tax increase amounted to between one percent and three
percent of state tax revenue.
- The remaining states enacted no
significant net tax increases. In fact, two states — Hawaii and Maryland —
actually reduced overall taxes in their 2002 sessions, as cigarette tax
increases in each of those states were outweighed by the implementation of
larger, previously enacted reductions to income taxes. In three other states,
Michigan, New York and Rhode Island, the revenue effect of significant cigarette
tax increases was in large part offset by the decision to allow reductions to
personal income taxes and other taxes to continue to phase in, with the result
that net tax increases were less than one percent of state tax revenue.
Louisiana voters approved a revenue-neutral “tax swap” — a sales tax cut and
income tax increase — that is described in more detail below.
Even among the states
enacting significant net tax increases this year, the amount of those increases
generally fell far short of compensating for the size of the large tax cuts
implemented from 1994 to 2001. Of the 16 states that raised taxes significantly
in 2002, 13 states — Arizona, California, Connecticut, Illinois, Indiana,
Kansas, Massachusetts, Nebraska, New Jersey, Ohio, Oklahoma, Oregon and
Pennsylvania — had enacted large tax cuts in the period from 1994 to 2001. But
only in three of those 13 states, Indiana, Kansas, and Nebraska, do the tax
increases of 2002 appear to be large enough to balance out the tax cuts of
1994-2001.
Failing to Raise Taxes When Needed: Consequences
for Public Services and Families
By avoiding a tax
increase, state policymakers may believe they are protecting their
constituents. In fact, the consequences of failing to raise taxes during a
budget crisis can be severe for state residents. The reason is that states face
balanced-budget requirements, and so failing to raise taxes in a fiscal crisis
typically leads to spending cuts. Indeed, this is what has happened. A July
NCSL report indicates that at least 29 states cut spending to balance their 2002
budgets, and at least 26 states cut spending to balance their 2003 budgets. The
true number is probably higher. Data from state budget departments shows that
nationwide, real, per-capita state spending declined in fiscal year 2002 and is
projected to decline again in 2003.
- The Kaiser Commission on Medicaid and the Uninsured reports that a large number
of states have reduced deeply health care benefits for low-income children,
families and senior citizens. Specifically, 25 states have changed eligibility
rules so that fewer people can participate, 22 states have reduced benefits for
those who are eligible, 21 states have instituted or increased copayments for
prescription drugs, and 16 states have increased copayments for some or all
services other than prescription drugs.
Many of the states
that enacted reductions in benefits and eligibility or increases in copayments
also chose not to raise taxes, including Delaware, Florida, Georgia, Idaho,
Iowa, Michigan, Missouri, Montana, Utah, Washington, and Wisconsin.
Notably, each of those states reduced taxes significantly from 1994 to 2001.
Had any one of those states rolled back some or all of the tax reductions of
1994-2001, the health care cuts could have been averted or minimized.
- A recent report by the Children’s
Defense Fund found that states — including many states that have avoided raising
taxes — have reduced funding for child care for working families. Many of those
budget reductions are already making it more difficult for working families to
pay for care. For instance, waiting lists for child care programs exist in 19
states and are growing larger. Over the past two years, Florida added more than
12,000 children to its waiting list, while Texas added more than 5,000
children. Tennessee and Minnesota also have greatly increased their waiting
lists. Eligibility for services has been restricted in a number of states,
including Colorado, Nebraska, New Mexico, Washington and West Virginia. Parent
fees have increased in a number of states, including Montana, New York,
Washington and West Virginia.
Altogether, increases
in consumption taxes — cigarette, general sales, alcohol and gasoline taxes —
have represented the great majority of the tax increases enacted in 2002,
representing $5.1 billion or 60 percent of the total.
By contrast, relatively little of the tax increases of 2002 (and in fact almost
all of the tax cuts) have been in personal income taxes. Total personal income
tax increases totaling about $1.3 billion were offset by other reductions in
personal income taxes — mostly previously enacted cuts that were allowed to go
forward — for a net increase of $700 million, or about 9 percent of the total
net increases. States with notable personal income tax increases include
Louisiana (see below), Massachusetts, Nebraska, Ohio and Oklahoma. (Oklahoma’s
increase was triggered by a provision in state law that automatically rolls back
a previously implemented reduction in income taxes when state revenues fail to
meet specified levels.)
Personal income taxes
are the broadest-based state taxes; in other words, they cover the broadest
range of economic activity. For that reason, they tend to grow in tandem with
the economy over time. States would be better prepared to fund services in a
stable manner in the future if they looked to personal income taxes rather than
consumption taxes as sources of new revenue.
For this reason, the
Louisiana “tax swap” approved by voters in November is important. An increase
in Louisiana’s income tax (achieved by reducing the income level at which the
top 6 percent rate takes effect, plus disallowance of a large portion of
itemized deductions) will pay for repeal of the state’s sales taxes on groceries
and utilities. Although revenue-neutral in the initial
few years, the measure will increase the state’s revenue over time; legislative
analysts point out that income taxes tend to grow far faster than sales taxes on
grocery and utilities taxes, yielding a projected $50 million in additional
revenue by 2007.
State Tax
Increases of 2002 Largely Have Failed to
Address Problem of Regressivity —
With Some Exceptions
Economists widely recognize that state and local tax systems are
“regressive”; that is, lower-income families pay a greater share of their
incomes in taxes than do higher-income families.
This regressivity results largely from states’ substantial reliance
on consumption taxes. Poor
families spend larger shares of their income on items subject to tax than
higher-income families do, so consumption taxes take larger shares of poor
families’ incomes. State
personal income taxes generally are at least somewhat progressive, because
they have rate structures that tax higher incomes at higher rates, or
because they exempt the first several thousand dollars of each family’s
income.
The large tax cuts states enacted from 1994 to
2001 tended to make tax systems more regressive, because states reduced
taxes paid predominantly by higher-income households – specifically,
personal income taxes, corporate income taxes, and inheritance taxes — far
more than they reduced sales taxes and other consumption taxes which are
most burdensome for lower-income families.
Of the $35 billion in net tax cuts enacted from 1994 to 2001, some
$28 billion were cuts in personal income taxes, corporate income taxes, or
inheritance or estate taxes;
only about $1 billion in net tax cuts were reductions to sales and excise
taxes. In other words, when
states cut taxes in the 1990s, the benefits of the tax cuts flowed
disproportionately to higher-income families.
Now that states have begun to raise taxes again, the burdens also
have been directed disproportionately to lower-income families.
This is because increases in
consumption taxes — cigarette, general sales, alcohol and gasoline taxes —
have represented the great majority of the tax increases of 2002,
representing $5.1 billion or 60 percent of the total.
Increases in personal and corporate income taxes have been far
smaller.
A few states appear to have recognized the
distributional consequences of raising consumption taxes.
The tax packages passed in
Massachusetts
and
Nebraska,
for instance, include not only consumption-tax increases that will more
heavily affect poor families but also increases in personal income taxes
that will most heavily impact high-income families (a capital-gains tax
rate hike in
Massachusetts,
a personal income tax rate increase in
Nebraska).
Indiana
and
Kansas
balanced their tax packages in a different way.
They set aside a portion of the revenue from increases in
consumption taxes to pay for expanded tax credits for low-income families.
Specifically,
Indiana
restructured and expanded its Earned Income Tax Credit, and
Kansas
increased both its state EITC and its sales tax credit.
Those measures will help blunt the disproportionate burden of
consumption tax increases on poor families.
Louisiana, in a referendum, went a step
further. The state cut sales
taxes on groceries and utilities and raising its income tax, thereby
reducing the overall burden of taxes on poorer families and increasing the
burden on higher-income families.
(Another state,
Tennessee,
also made a very small gesture of recognition of the regressivity problem:
the state exempted from its one-penny sales tax increases the
purchase of grocery-store food, a particularly regressive component of the
sales tax. Nonetheless, since
the sales tax increase will apply to all other purchases, and since
Tennessee
neither coupled the sales tax increase with more progressive tax increases
nor enacted offsetting tax relief for poor families, the overall tax
increase still will be more burdensome on poor families than on
higher-income families.)
|
Another $2.1 billion of
the tax increases of 2002 — about 25 percent of the total — were increases in
corporate income taxes. Nearly all of this came from a $600 million to $700
million increase in New Jersey and a $1.2 billion increase in California. The
New Jersey action in particular represents an important step toward reforming
that state’s corporate income tax, because much of the revenue comes from
establishing an alternative tax base that is intended to ensure that more
profitable corporations pay New Jersey taxes and thereby stem the long-term
decline in corporate income tax revenues; another significant portion of revenue
comes from closing loopholes in the corporate tax base.
New Jersey’s corporate income tax increase, therefore, will improve the state’s
ability to raise revenue over both the short- and long-term. California’s
increase is less positive for the middle- and long terms, because it is only in
effect for tax years 2002 and 2003, and starting in 2004 it actually gives
corporations a larger tax break than they now enjoy. In essence, the California
legislation actually gives most of that $1.2 billion back to California
corporations beginning in 2004, plus an additional tax cut, and fails to fix any
of the problems contributing to long-term decline in the state’s corporate
income tax. But both the California and New Jersey tax increases have the
virtue of avoiding placing disproportionate new tax burdens on low- and
moderate-income families.
The relatively scant
increases in personal income taxes and corporate taxes enacted by states in 2002
stand in sharp contrast with the large cuts in personal income taxes and in
other progressive taxes from 1994 to 2001. The great majority of the tax
reductions enacted from 1994 to 2001— some 81 percent of total tax cuts,
totaling some $27 billion in annual lost revenue to 37 states — were reductions
in personal income taxes or similarly progressive taxes. By contrast, just 9
states cut general sales taxes significantly, for a total of only about $3.4
billion. In addition, several states actually increased sales or excise taxes.
The net reduction in consumption taxes totaled about $1 billion, or less than 4
percent of total tax cuts.
How Can States Raise Taxes
for Long-Term Adequacy?
This analysis suggests that states have both a
short-term revenue problem and a long-term revenue problem. The short-term
problem is that they must replace some $38 billion in annual tax revenue.
The long-term problem is that if replacement revenues are not well designed,
states will continue to lose revenue as a result of structural problems that
cause gradual erosion of tax bases. Several options exist that can address
both of these problems.
-
States can reverse some of the income
tax cuts that were enacted in the 1990s. For instance, some 21 states cut top
income tax rates from 1994 to 2001. In retrospect, it appears that many of
those income tax cuts should have been recognized as unsustainable. In 2002,
for instance, Massachusetts reversed 1990s income tax reductions that had become
unaffordable. Similarly, Oklahoma benefited from a provision of a 1990s tax
rate cut that required the rate cut to be reversed if the state got into fiscal
problems.
- States can impose a temporary
surcharge on income taxes. Although such temporary action would not improve the
long-term prospects for state tax systems, it also would not make the situation
worse by increasing the reliance on slow-growing revenue sources such as sales
and excise taxes. Nebraska and (in 2001) North Carolina have taken such
actions, as did many states in the early 1990s. States may also be able to find
other ways to raise more money from income taxes; Louisiana, for instance, is
reducing the itemized deductions that taxpayers may claim.
- States can raise more money from their
corporate income taxes. Although the corporate income tax has been declining as
a revenue source over time, states could stem this decline by closing loopholes
and by creating alternative tax bases that
ensure that profitable corporations pay at least some tax in states where they
do business. The corporate tax increases enacted in 2002, most notably New
Jersey’s as well as increases enacted in North Carolina and Ohio in 2001 were
attempts to fix some of the problems in the corporate tax.
- States could raise sales tax revenue
by broadening their sales tax bases to include more services. Such base
expansion was a significant part of Nebraska’s revenue-raising package in 2002,
and other states are considering similar action. Unlike consumption tax rate
increases, the revenue from which is likely to decline over time relative to the
economy, sales taxes on services may be more likely to keep pace with economic
growth. In some cases they may also be less burdensome on low- and
moderate-income consumers.
- States could take steps to protect
their estate taxes by “decoupling” from the federal estate tax changes, as some
16 states have done. (See box above.)
At the least, states should not enact new tax
cuts or continue to implement phased-in tax cuts. They should follow the
lead of states such as Massachusetts, Michigan, and Oregon, all of which in 2002
postponed at least some planned tax cuts, as several other states did in 2001.
Indeed, such states should consider going one step further and canceling those
tax cuts altogether in recognition that those tax cuts were predicted on the
unusual, unsustainable revenue growth of the 1990s.
|
States That Cut
Taxes Most in the 1990s Financed the Tax Cuts
with Revenue Windfalls; Now They Face Big Deficits
Many states that
cut taxes in the 1990s also experienced strong economic growth.
The links between economic growth and tax actions are
complicated, but it is likely that the economic growth in
tax-cutting states was likely a contributor to the budget
surpluses that helped pay for the tax cuts more than it was a
result of the tax cuts, as a few analysts have argued.
In other words, in most states, the tax cuts of the 1990s
were not an expression of a particular “small-government” fiscal
policy, but rather resulted from revenue windfalls generated by
the economic boom. States
that enacted big tax cuts often did so because they thought they
could afford it, not because they desired to cut spending.
This conclusion
is supported by an examination of the states near the ends of the
tax-cutting spectrum in the 1990s.
It turns out that state government spending rose no less in
states that cut taxes the most than in states that cut taxes the
least, and in some cases it rose even more.
For instance, the ten states that cut taxes the most during
the 1994-2001 period experienced median spending growth of 6.9
percent annually. The ten
states that cut taxes least during that period had median spending
growth of 5.7 percent.
Not surprisingly,
the states that cut taxes the most in the 1990s generally are in
the biggest fiscal trouble now.
The ten largest tax-cutting states of the 1990s had median
budget gaps in 2002 and 2003 equal to 9 percent and 13 percent of
state spending respectively.
The ten states that cut taxes the least in the 1990s had a
median budget gap in 2002 equal to 5 percent of state spending and
a 1 percent gap in 2003.
State Tax Cuts. 1994-2001, and Fiscal Outcomes,
2002-03
|
|
Tax cuts
as a percent of total taxes,
1994-2001 |
Annual state spending growth,
1994-2000 (nominal) |
Budget deficits as share of
spending, 2002 |
Budget deficits as share of
spending, 2003 |
|
Ten states
enacting very large tax cuts |
16.2% |
6.9% |
9.0% |
13.0% |
|
Ten states
enacting smaller or no tax cuts |
0.3% |
5.7 % |
4.9% |
1.0% |
|
All fifty
states |
8.2% |
6.1% |
5.4% |
5.3% |
Note: States
enacting very large tax cuts from 1994 to 2001 include Arizona,
Colorado, Connecticut, Delaware, Massachusetts, Michigan,
Minnesota, New Jersey, New York, and Oregon. States enacting
relatively modest or no tax cuts from 1994 to 2001 include
Alabama, Alaska, Mississippi, Nevada, New Hampshire, North Dakota,
South Carolina, Tennessee, West Virginia, and Wyoming.
Sources:
National Conference of State Legislatures;
U.S.
Census Bureau Government Finances; Center on Budget and Policy
Priorities. |
|
The Economic
Impacts of Tax Changes
In order to
balance their budgets in the current fiscal crisis, with most of
their reserves depleted, states face a choice:
They can cut services while protecting the large tax cuts
of the 1990s; or they can protect public services by raising
taxes. Which choice states
make could have significant implications for whether the nation’s
economy emerges from the recent recession or whether the recession
is extended. Although the
economic perils of tax increases are often touted by their
opponents, spending cuts could actually be more damaging to the
nation’s economy than tax increases.
As Nobel Prize-winning economist
Joseph Stiglitz and Peter Orszag of the Brookings Institution have
pointed out, a $1 reduction in state public-sector spending
typically results in a $1 reduction in a state’s economic
activity. A $1 increase in
taxes, by contrast, is likely to result in a smaller reduction in
a state’s economic activity, because to some extent the tax
increase would be financed out of reduced savings, or from reduced
out-of-state consumption.
This is particularly true of tax increases on higher-income
individuals, because such individuals are most likely to have
access to savings.
Stiglitz and
Orszag conclude:
If anything, tax increases on
higher-income families are the
least damaging mechanism
for closing state fiscal deficits in the short run. Reductions in
government spending on goods and services, or reductions in
transfer payments to lower-income families, are likely to be more
damaging to the economy in the short run than tax increases
focused on higher-income families. In any case, in terms of how
counter-productive they are, there is no automatic preference for
spending reductions rather than tax increases.
The focus
of Stiglitz and Orszag’s analysis is the short-run impacts of
taxes and spending on state economies.
Economic research into the long-term tradeoff between taxes
and public expenditures also suggest public expenditures can
contribute as much, if not more, to economic growth as low taxes.
In hundreds of surveys, business executives have placed
taxes lower on the list of important location factors than such
factors as labor availability, costs and training; access to
markets; access to raw materials; transportation costs; public
services; and quality of life.
Careful studies of the relationships between taxes,
spending, and job growth show that undermining a state’s
educational system, its infrastructure, or other services vital to
businesses and workers over the long run can do more damage than
abandoning tax cuts that are no longer affordable.*
____________________________
*
See for example, Michael Wasylenko, “Taxation and Economic
Development: The State of
the Economic Literature,”
New England Economic Review, March-April 1997, reprinted in
State Tax Notes, June 23, 1997, pp. 1883-95; Robert G. Lynch,
Do State and Local Tax
Incentives Work?, Economic Policy Institute, Washington, D.C.,
1996; Timothy Bartik, Who
Benefits From State and Local Economic Development Policies?,
W.E. Upjohn Institute for Employment Research, Kalamazoo,
Michigan, 1991. |
Table 3
Current Budget Problems in 34
States with Major Tax Cuts in the 1990s
(tax cuts exceeding 3% of state
tax revenue)
|
|
Examples of Major 1994-01 Tax Cuts |
Tax Increase Enacted in 2002 |
Medicaid Cuts Enacted in FY 02 and/or
Planned in FY 03 — Examples* |
Cuts in Other Services — Some Examples |
|
Major tax increase (over 3% of state tax
revenue) |
Smaller tax increase (between 1% and 3%) |
|
Arizona |
Reduced personal income
tax rates, reduced corporate taxes, eliminated state property tax. |
|
Cigarette tax increase
(voter-approved) |
Considering cutting
eligibility for pregnant women. |
Froze child care provider
reimbursements. Reduced aid to disabled adults and funding for after-school
programs. |
|
California |
Top income tax rates
expired, increased dependent credit, reduced vehicle taxes. |
|
Temporary business tax
increase |
Delayed coverage
expansion for 200,000 parents, reduced funding to local eligibility offices |
Froze child care provider
reimbursements. Cut funding for education for welfare recipients. $750
million in unspecified cuts to be made by governor. |
|
Colorado |
Reduced personal income
tax rate, reduced sales tax rate, new tax credits |
|
|
Reductions in eligibility
planned or likely |
Five counties have closed
child care enrollment. University tuition increase of up to 9 percent for
2002-03. |
|
Connecticut |
Reduced personal and
corporate income taxes, motor fuel taxes, and inheritance taxes |
|
Cigarette and gasoline
tax increases, limit corporate credits |
Plans to cut eligibility
for seniors; considering benefit reductions. |
Closed child care
enrollment for many families. Closed special courtrooms for drug offenders. |
|
Delaware |
Reduced personal income
tax rates |
|
|
Instituted copayments and
reduced outreach. |
Delaware State University
tuition up 7 percent for 2002-03. |
|
Florida |
Reduced intangibles tax |
|
|
Reduced dental benefits
for 28,000 individuals, reduced eligibility for senior citizens. |
Increased child care wait
lists. Several thousand state workers laid off. |
|
Georgia |
Reduced personal income
taxes, eliminated sales tax on groceries |
|
|
Estimated 5,000
individuals will lose coverage; reduced coverage for those moving from
welfare to work. |
|
|
Hawaii |
Reduced personal income
taxes and sales tax on business-to-business sales |
|
Cigarette tax increase
offset by income tax cut |
|
Planned teacher bonuses
canceled. |
|
Idaho |
Reduced personal income
tax rates |
|
|
Eliminated some dental
benefits, reduced eligibility for disabled. |
Tuition increases at
state universities of 10-12 percent two years running. |
|
Iowa |
Reduced personal income
tax rates and inheritance tax |
|
|
Reduced dental services. |
State university tuition
up 18.5 percent in 2002-03; additional 17.6 percent increase proposed for
next year. State worker furloughs and layoffs. |
|
Kansas |
Repealed inheritance tax,
increased personal income tax deduction, and new corporate tax credits |
Sales tax rate increase,
other increases |
|
Reductions in benefits
and eligibility planned or likely |
University of Kansas
tuition increased over 20 percent for 2002-03; cut aid to schools $17.5
milion. |
|
Maine |
Increased personal
exemption, reduced sales taxes |
|
|
|
|
|
Maryland |
Reduced personal income
tax rates, new sales tax exemptions, corporate tax cuts |
|
Cigarette tax increase,
offset by income tax cut |
|
Tuition at state
universities increased 9.5 percent over two years. |
|
Massachusetts |
Reduced personal income
taxes and corporate income taxes; reduced estate tax |
Income tax and cigarette
tax increases |
|
50,000 individuals lost
health coverage. Copayments increased. |
Reduced number of child
care slots; reduced funding for employment services for cash assistance. |
|
Michigan |
Reduced personal income
tax rate and single business tax rate |
|
Cigarette tax increase,
offset by income tax cut |
Postponing/dropping plan
to expand coverage to low-income working families. |
Froze revenue-sharing
with local governments for 2003 at nominal 2002 levels. |
|
Minnesota |
1999 and 2000: reduced
personal income tax rates |
|
|
Eligibility cuts planned
or likely |
University tuition
increases of 7.5 percent to 16 percent for 2002-03. |
|
Missouri |
Reduced personal income
taxes, reduced sales tax on groceries |
|
|
Health coverage may be
eliminated for 36,000 low-income parents. Dental coverage eliminated for
300,000 people. |
State university tuition
increased 14 percent for 2002-03. |
|
Montana |
Reduced personal income
tax, repealed inheritance tax |
|
|
Increased cost-sharing
(highest in nation). |
Increased parent fees for
child care and froze child care provider reimbursements. Cut local school
funding below 2002 levels. |
|
Nebraska |
Reduced personal income
taxes |
Sales and income tax
increases, others |
|
25,000 people lost health
insurance |
Cut eligibility for child
care subsidies. |
|
New Jersey |
Reduced personal income
tax rates |
Corporate tax increases,
others |
|
Stopped enrolling
additional working poor families. |
State university tuition
increased by up to 10 percent. |
|
New Mexico |
Reduced personal income
tax rates, reduced gasoline tax |
|
|
|
Cut eligibility for child
care subsidies. |
|
New York |
Reduced personal income
tax rates, reduced estate tax, reduced corporate income tax rates, repealed
sales tax on clothing |
|
Cigarette tax increase,
offset by income tax cut |
|
|
|
North Carolina |
Reduced personal income
taxes, repealed intangibles tax, repealed sales tax on groceries |
|
|
Reduced eligibility for
pregnant teens. |
Aid to local governments
cut $333 million for FY 2003; localities will have option to raise sales tax
½ cent to make up the difference. |
|
Ohio |
Reduced personal and
corporate income taxes and estate tax |
|
|
Considering limits on use
of prescription drugs. |
Reduced state housing
assistance for the elderly. Average 18 percent tuition increase for new
state university students. |
|
Oklahoma |
Reduced personal income
tax rates |
|
Raised personal income tax rates |
Planned elimination of
coverage for 79,000 people. |
|
|
Oregon |
Reduced personal and
corporate income taxes |
|
Cigarette tax increase |
Will increase
cost-sharing and reduce benefits. |
Eliminated substance
abuse treatment for 2,500 individuals. Community college enrollment cut by
25,000. |
|
Pennsylvania |
Reduced corporate income
and franchise taxes |
|
Cigarette tax increase |
Eligibility reductions
planned or likely. |
Expanded child care wait
lists; Penn State tuition up 13.5 percent for 2002-03. |
|
Rhode Island |
Reduced personal income
tax rate |
|
Cigarette tax increase,
offset by income tax cut |
Cut benefits, raised
copayments for families and children. |
Cancelled planned child
care expansion; university tuition up 8.7 percent for 2002-03. |
|
Texas |
Reduced property tax
(replaced lost revenue from state funds) |
|
|
Considering copayment
increases and other changes |
|
|
Utah |
Reduced personal income
tax rate, sales tax rate |
|
|
Cut benefits, raised
copayments |
University of Utah
tuition increase of 9.3 percent for 2002-03. |
|
Vermont |
Reduced personal income
tax rate |
|
Cigarette tax increase |
Considering copayment
increases. |
|
|
Virginia |
Reduced local vehicle
property tax (replaced lost revenue from state funds) |
|
|
|
Plan to lay off several
thousand workers; university tuition increases averaging 11 percent
implemented and additional increases considered. |
|
Washington |
Reduced business taxes
and vehicle taxes |
|
|
Eliminated coverage for
legal immigrants in Medicaid, reduced eligibility for elderly and disabled.
Further cuts considered. |
Cut eligibility for child
care assistance; increased parent copayments. University tuition increased
16 percent. K-12 aid cut $92 million. |
|
Wisconsin |
Reduced personal income
taxes |
|
|
Underfunding of Medicaid
and children’s health program by $60 million will lead to unspecified cuts
later. |
Average tuition increase
of 9 percent at state universities. |
|
Sources: Kaiser Commission on Medicaid and the
Uninsured; Children’s Defense Fund; National Association of State Colleges and
Land-Grant Universities; National Conference of State Legislatures; news
reports; Center on Budget and Policy Priorities.
Note: Major tax cuts and increases are those
exceeding 3 percent of state tax revenue. States with smaller tax cuts in the
1990s are not shown.
*Many states also reduced or froze Medicaid
payments to providers.
|
Appendix
About the Data in This Report
The primary sources for the aggregate
dollar amounts of tax changes in the years 1990 through 2001 are a series of
annual reports issued by the National Conference of State Legislatures (NCSL)
entitled State Tax Actions (prior to 1993, State Budget and Tax
Actions). NCSL collects its estimates of the effects of tax changes from
state legislative fiscal offices, and reports these changes by state and by type
of tax. The 2002 data in this report are based on preliminary data from NCSL’s
forthcoming report for this year, combined with information collected directly
from state revenue departments and legislative fiscal offices.
The NCSL data generally reflect the
effects of tax changes implemented in the fiscal year following the one in which
the change was enacted. For instance, the aggregate tax changes reported in
2000 State Tax Actions are based on estimates of revenue impacts for
fiscal year 2000-01 (the 12-month period which in most states ended June 30,
2001).
The dollar totals in this analysis do
not exactly equal the total tax changes reported by NCSL in each of the years
covered. Adjustments were made for a variety of reasons. Most of the
adjustments are consistent with principles outlined in a series of analyses
produced by the Nelson A. Rockefeller Institute of Government from 1991 to 1995.[14]
- NCSL has changed its method of accounting for tax
changes since 1990. In the early 1990s, NCSL followed what it called the
“baseline method.” Under this method, when a state postponed a scheduled tax
reduction, it was counted as a tax increase. The expiration of a temporary tax
was not counted at all. And the out-years of a multi-year phased-in tax change
were not counted either. NCSL now tends to favor the “taxpayer liability”
method, which focuses on year-to-year changes to actual taxes paid. Under this
method, the postponement of a scheduled tax cut usually does not count, but the
expiration of a temporary tax change and the out-years of a phased-in tax change
are both counted when they take effect. The NCSL data from the early 1990s were
adjusted in this report to conform to the “taxpayer liability” method NCSL now
tends to use. In addition, to maintain consistency, the expiration of a
one-time tax reduction or tax rebate is counted in this report as a tax
increase; in other words, the tax-reducing impact of one-time tax cut or rebate
is offset by the tax-increasing impact of its expiration the following year.
(Note that the National Association of State Budget Officers, which produces
similar analyses of state fiscal actions, continues to follow the “baseline”
method.)
-
Unlike in NCSL reports, the dollar amounts in this
report generally exclude changes in local taxes even when those changes were
mandated or financed at the state level. For example, state-mandated,
state-financed reductions in vehicle property taxes in Indiana, Rhode Island and
Virginia are excluded, as are a 1997 property tax cut in Texas and the large
reduction in local property taxes that was part of Indiana’s 2002 tax bill. The
1994 consumption tax changes in Michigan, which financed local property tax
reductions, are also excluded. In general, these exclusions tend to understate
the extent of state tax cuts in the 1990s, and overstate the net tax increases
in 2002.
- Health care provider taxes, which many states
increased or decreased in the 1990s in response to technical issues
surrounding the financing of Medicaid programs, are not included in this
report. NCSL includes such taxes.
- Actions taken to conform to or
decouple from changes in federal tax laws are not reported consistently to NCSL
in the State Tax Actions survey, even though such actions can
dramatically affect total liability (for an example, see box
above).
Therefore, they are not counted in this analysis either as tax increases or as
tax decreases.
-
In states where major tax changes went into effect partway through a fiscal
year, the revenue estimates are adjusted to reflect the impact of the change
in the first full year following implementation.
Unemployment insurance taxes, motor
vehicle license fees and other types of fees, and revenues from state lotteries,
none of which are included in the NCSL tax data, are also excluded from this
analysis.
End Notes:
A number of additional states took steps other than tax increases to boost
revenue, such as changing the statutory relationship between state tax codes
and the federal code to avoid revenue reductions stemming from federal tax
changes, accelerating tax payment dates, delaying the effective dates of
previously enacted tax cuts, or increasing fees. A few states went in the
opposite direction, for instance changing the relationship between state and
federal tax codes in such a way as to reduce revenues. This analysis does
not count such actions as either tax increases or tax reductions; see
Appendix.
These are net figures, reflecting both tax increases and tax cuts. A few
states raised some taxes in the 1994-2001 period, such as gasoline or
cigarette taxes, while cutting other taxes.
Inflation-adjusted state spending per person increased by an average of 2.8
percent per year between 1989 and 1999, less than the 3.2 percent average
annual growth between 1959 and 1999 and about the same rate as overall
economic growth in the 1990s. See Elizabeth C. McNichol and Kevin Carey,
Did States Overspend During the 1990s?
https://www.cbpp.org/10-15-02sfp.htm Center on Budget and Policy
Priorities, October 2002.
A few states in the 1990s did implement temporary tax reductions, such as
one-time tax rebates in Connecticut and Minnesota that have now ended or
temporary sales tax rate reductions such as California’s. Those temporary
tax cuts are not counted within this analysis. Note also that each of the
states enacting temporary tax reductions also enacted large permanent tax
cuts that remain in place.
These figures were calculated from the state revenue data that the
Rockefeller Institute of Government collects and reports in its State
Revenue Reports (http://www.rockinst.org/publications/state_revenue_reports.html).
Rockefeller Institute data generally include only general-fund taxes and
therefore exclude motor fuel taxes and some other taxes.
Some other states raised taxes, but the net revenue effect was less than 1
percent of total revenue. A number of additional states took other steps to
boost revenue, such as changing the statutory relationship between state tax
codes and the federal code to avoid revenue reductions stemming from federal
tax changes, accelerating tax payment dates, delaying the effective dates of
previously enacted tax cuts, or increasing fees. A few states went in the
opposite direction, for instance changing the relationship between state and
federal tax codes in such a way as to reduce revenues. This analysis does
not count such actions as either tax increases or tax reductions.
In Kansas and Nebraska, the net tax increases of 2002 roughly appear to have
equaled the net tax cuts of 1994-2001. In Indiana, the tax increase of 2002
at the state level exceeded the tax cuts of the earlier period only because
the tax increase of 2002 also financed a very large reduction in local
property taxes that was made necessary by a court decision.
Kaiser Commission on Medicaid and the Uninsured, Medicaid Spending
Growth, September 2002.
The reductions in several of those states are described in Leighton Ku,
Donna Cohen Ross, and Melanie Nathanson, State Medicaid Cutbacks and the
Federal Role in Providing Fiscal Relief to States,
https://www.cbpp.org/7-12-02health.htm Center on Budget and
Policy Priorities, revised August 2, 2002.
Children’s Defense Fund, Low-Income Families Bear the Burden of State
Child Care Cutbacks, September 2002.
Several other states, including Oregon, postponed scheduled personal income
tax reductions; for purpose of this analysis, as described in the
Methodology section, such postponements are not considered tax increases.
A portion of that New Jersey revenue, about $200 million, is temporary in
nature because it derives from a suspension of a tax deduction for operating
losses that is effective only in 2002 and 2003; corporations may be able to
recoup much of that amount in later years. The remaining $400 million to
$500 million is a permanent revenue increase. These figures exclude an
estimated $200 million to $300 million in one-time revenue that the state
will gain in fiscal year 2003 only due to timing shifts and to the
retroactive implementation of some of the changes.
Some ways states can do this are described in Michael Mazerov, Closing
Three Common Corporate Income Tax Loopholes Could Raise Additional Revenue
for Many States,
https://www.cbpp.org/4-9-02sfp.htm Center on Budget and Policy Priorities, April 2002.
[14]Steven
D. Gold, “1995 Tax Cuts: Widespread But Not Revolutionary,” December 1995;
“State Tax Cuts: 1994 as Prelude to 1995,” January 1995; “Tax Increases
Shriveled in 1993,” December 1993; “The Anatomy and Magnitude of State Tax
Increases in 1992,” January 1993; and “How Much Did State Taxes Really Go Up
in 1991?”, February 1992. All published by the Center for the Study of the
States (now the Fiscal Studies Program), Nelson A. Rockefeller Institute of
Government, Albany, N.Y.