
Where Has All the Surplus Gone?
Fact Sheet
If you cannot access the files through the links, right-click on the underlined text, click "Save Link As," download to your directory, and open the document in Adobe Acrobat Reader. |
On November 1, the Center on Budget and Policy Priorities released an analysis of the causes of the shrinkage of the budget surplus in recent months. The analysis is based on new budget estimates that the Senate and House Budget Committees issued in October.
The Center's analysis finds that since the spring, the projected budget surplus has declined by $3 trillion over ten years, with half of this decline being due to last June's tax cut. Another quarter of the decline has been caused by the downturn in the economy and other changes in budget estimates. The final quarter comes from three sources: 1) increases in existing programs, including added defense funding the President requested in June; 2) legislation enacted in response to the terrorist attacks of September 11; and 3) an assumption that Congress will shortly enact $100 billion in economic stimulus legislation. After 2002, the degree to which the decline in the surplus is due to the tax cut becomes larger with each passing year. By 2010, nearly 70 percent of the decline in the projected surplus will be due to the tax cut. The report's findings include:
- Last January, the Congressional Budget Office projected a total budget surplus of $313 billion for fiscal year 2002 and $5 trillion over the ten-year period 2001-2010. But the projected surpluses have melted away: 2002 now looks as though it will end in deficit, the first deficit in four years, and the ten-year surplus in the total (or unified) budget has shrunk to $2 trillion.
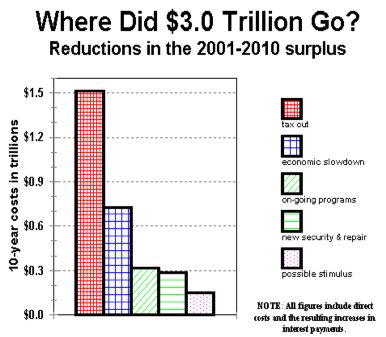
- The tax cut is responsible for half of the drop in the surplus over the next ten years, with its impact becoming especially pronounced as the decade continues. By 2010, the tax cut will account for 69 percent of the lost surplus.
- If we look just at the effects that legislation enacted this year (plus the stimulus package) will have on the surplus — and ignore the effect of the economic slowdown — we find that 71 percent of the reduction in the surplus over ten years that is due to the costs of this legislation is attributable to tax cuts. Some 17 percent comes from increases in defense funding, and 12 percent from increases in non-defense programs. Some of the non-defense increases reflected in these figures are costs related to the attacks of September 11: the non-defense increases include the costs of assistance to the airlines, payments to victims and their families, cleanup and reconstruction in New York, and additional domestic security.
- The current projection of $2 trillion in total budget surpluses over ten years substantially overstates the size of the surplus because it does not take into account the significant costs that will result from legislation that Congress is either very likely or virtually certain to pass in coming years, such as the extension of expiring tax credits that always are renewed, the farm bill, relief from the swelling individual alternative minimum tax (AMT), measures to respond to natural disasters, and a Medicare prescription drug benefit. Nor does this projection include the cost of extending the provisions of the tax cut enacted this spring; all of the provisions of the tax cut expire between 2004 and 2010. The cost of these items equals or exceeds $1 trillion over ten years.
- It also should be noted that the $2 trillion surplus projection includes the Social Security surplus, which is projected to be $2.4 trillion over the decade. Without the Social Security surplus, the current ten-year projection would show a deficit of $0.4 trillion. Moreover, when the $1 trillion in additional likely costs that were just described is included, the deficit outside Social Security rises to approximately $1.5 trillion over ten years.
- The shrinkage of the surplus does not reflect excessive growth of federal expenditures. As a share of the economy, federal spending is much lower now than in the 1980s and the 1990s and is projected to fall still further in coming years and to reach its lowest level as a share of the economy since the mid-1960s. Federal expenditures averaged 22.1 percent of GDP during the 1980s and 20.1 percent of GDP during the 1990s. If all of the likely expenditures noted above are incurred, expenditures will average 18.4 percent of GDP from 2002 through 2010 and equal 17.7 percent of GDP by 2010, their lowest level since 1965. The disappearance of the surplus outside Social Security is occurring, despite the fact that expenditures are declining as a share of the economy, because revenues are slated to decline at a much faster rate.