|
October 10, 2006
TAX CUTS ON LAYAWAY:
The Short– and Long-term Fiscal Implications of 2006 State Tax Actions
By Nicholas Johnson and Sarah Farkas
State governments face major fiscal challenges in the next few years. They will need adequate revenue bases to tackle those challenges. But a number of states in 2006 cut taxes deeply without identifying how the tax cuts will be financed. They could do this, despite balanced budget requirements, because they postponed the bulk of the fiscal impacts to years beyond the states’ current budget windows. This failure to plan ahead will make it even harder for those states (and any states that follow their lead) to address upcoming budgetary needs.
The tax actions that states took in 2006 appear on their surface to be modest in their fiscal impacts. Of the 22 states that cut taxes at all, only five states’ tax cuts are having a “significant” impact on tax collections in the current budget year (FY 2007), meaning that they cost more than 1 percent of state tax collections. From an entirely short-term perspective, the combined cost of the tax cuts in those five states and in five other states with important tax cuts adds up to only $942 million in lost revenue in 2007 – 0.7 percent of those ten states’ tax collections. (The ten states are Arizona, Iowa, Michigan, Nebraska, New York, North Carolina, Oklahoma, Rhode Island, Utah and Wyoming).
Viewed over a longer period of time, however, the tax cuts in those ten states have a far larger annual cost, and there is substantial reason to believe they are unaffordable.
- In fiscal year 2008, which in most states begins next July, the estimated cost of those ten states’ tax cuts more than quadruples from the level identified in 2007 budgets. This is a problem because almost none of those ten states have written budgets for 2008, and therefore there is no mechanism for making sure that those tax cuts can be funded. Nor will there likely be any further consideration of priorities between the tax cuts — which will be included in future revenue estimates — and other actions that likely will be necessary to balance the state budget in light of the tax cuts, such as forgoing necessary public services, raising other taxes, or raiding reserve funds.
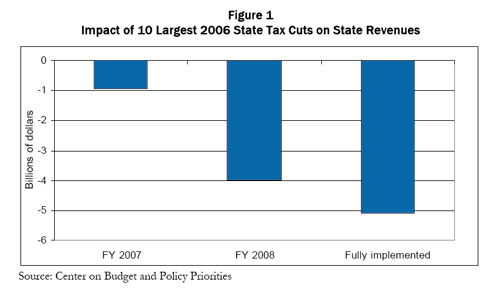
- Four of those ten states — Michigan, Oklahoma, Rhode Island and Iowa — enacted tax cuts that will be even costlier in 2009 and into the next decade than they are in either 2007 or 2008. Adding those future fiscal impacts to the total brings the annual cost across all ten states to $5.1 billion, or about 4.0 percent of those ten states’ tax revenues. (See Figure 1)
- Other states also have taken tax actions in 2006 that may have significant negative consequences in future years. For example, Idaho, South Carolina, and Texas all enacted large cuts to local property taxes that are financed by smaller tax increases at the state level, resulting in net fiscal costs to the state.
It is well documented that states already face a host of fiscal problems in the next few years, including long-term erosion in the sales tax and the corporate income tax, increasing demographic pressures, and cuts in federal aid, among others. These tax cuts will further diminish the stability and sustainability of state finances. They will reduce the amount of revenue that is available in future years to pay for public services such as education, health, transportation and public safety, and they will reduce the resources available to set aside in rainy day funds or other reserves. They will also diminish those states’ ability to pay for other forms of tax relief since states generally must balance their budgets.
But in states enacting tax cuts, these tradeoffs between services, reserves, and other forms of tax relief will not be considered explicitly in future years as part of the budget process. Rather, the rapidly rising costs of the already enacted tax cuts will be completely hidden because they are implicitly incorporated into revenue estimates that are prepared in most states at the beginning of the budget process. Costly as they may be, these tax cuts — and the resulting revenue loss — may never receive reconsideration in the course of future budget discussions.
The Large Tax Cuts of 2006 Include Several That Are Highly Backloaded
This analysis focuses on ten states that in 2006 each enacted significant state-level tax cuts that, when fully phased in, will cost at least 1 percent of each state’s 2005 tax revenue. The states are listed in Table 1.[1] This analysis finds that nearly all of them are structuring those tax cuts in ways that pose fiscal problems in the not-too-distant future. The reason is that several of the largest tax cuts are “back-loaded” — that is, their full revenue loss and resulting budget pressure will not be felt for several years.
According to official projections by state agencies, the cuts will reduce state revenues in FY 2007, which in most states began on July 1, 2006 and ends on June 30, 2007, by $942 million, or 0.7 percent of those ten states’ total tax collections. This relatively small fiscal impact, combined with short-term revenue growth projected in many states, means that many of the tax-cutting states were able to accommodate the tax cuts into their FY 2007 budgets.
But in fiscal year 2008, the total cost of these ten states’ tax cuts will more than quadruple from the 2007 cost, rising to $4.0 billion, or 3.2 percent of the ten states’ tax revenues. A substantial portion of the projected increase results from a very large tax cut in Michigan that takes effect January 1, 2008. Other states where the fiscal impact will double or triple include Arizona, Iowa, Nebraska, New York, North Carolina, Oklahoma, and Rhode Island. Only Wyoming shows the full impact of the tax cut in its 2007 budget (See Table 1).
These rising out-year increases are potentially problematic because nine of these ten states have not yet formulated their FY 2008 budgets. This is because they budget either on an annual basis, or on a biennial basis that extends only through 2007. As a result, in those nine states, the full cost of the tax cuts has not yet been taken into account. The exception is Wyoming, whose two-year budget extends through 2008 and whose temporary tax cut expires at the end of that fiscal year. The other states will have to figure out how to accommodate those tax cuts into the FY 2008 budget when they begin budget deliberations sometime in early 2007.
Several states will not face the full hit of the 2006 tax cuts until even later than FY 2008. Major tax cuts in Michigan, Oklahoma, Rhode Island and Iowa will not reach their full fiscal impact until fiscal years 2009, 2011, 2012 and 2015 respectively (See Figure 2, 3, and 4). By that time, it is likely that many of the legislators and governors who enacted the tax cuts will no longer be in their current positions and therefore will not have to face the fiscal consequences of the tax cuts. Taking into account the final, full-year fiscal impacts, the total annual effect of the ten largest 2006 tax cuts equals $5.1 billion, or about 4.0 percent of those ten states’ tax revenues.
Table 1:
2006 State Tax Cuts with Final Fiscal Impacts Exceeding One Percent of State Tax Collections
|
|
|
Projected Revenue Loss |
|
State |
Description |
FY 2007 ($millions) |
FY 2008 ($millions) |
FY 2007 (% of 2005 tax revenue) |
FY 2008 (% of 2005 tax revenue) |
Year of largest impact
(% of 2005 tax revenue) |
|
Arizona |
Income tax rate cuts |
-156.1 |
-334.0 |
-1.4 |
-3.0 |
-3.0 |
|
Iowa |
Increase in income tax exclusion for seniors. |
-12.0 |
-34.0 |
-0.21 |
-0.6 |
-2.1 |
|
Michigan |
Repeal “single business tax” and enact state EITC. |
— |
-1,520.0 |
— |
-6.5 |
-9.1 |
|
Nebraska |
Income and sales tax cuts. |
-31.2 |
-77.0 |
-0.82 |
-2.0 |
-2.0 |
|
New York |
Child tax credit; gasoline sales tax cap. |
-150.0 |
-825.0 |
-0.3 |
-1.6 |
-1.6 |
|
North Carolina |
Accelerate income and sales tax cuts. |
-347 |
-694 |
-1.9 |
-3.7 |
-3.7 |
|
Oklahoma |
Income tax rate cuts, capital gains cut, estate tax repeal, standard deduction increase. |
-94.9 |
-294.1 |
-1.38 |
-4.3 |
-9.2 |
|
Rhode Island |
Alternative top income tax rate. |
-7.2 |
-14.4 |
-0.27 |
-0.5 |
-2.8 |
|
Utah |
Reduce sales tax on groceries; cut income tax. |
-101.1 |
-148.0 |
-2.2 |
-3.2 |
-3.2 |
|
Wyoming |
Eliminate sales tax on food. |
-43.0 |
-43.0 |
-2.5 |
-2.5 |
-2.5 |
|
Total |
|
-942.4 |
-3983.5 |
-0.74 |
-3.15 |
-4.02 |
| Sources: State legislative fiscal offices or revenue departments except where noted; Center on Budget and Policy Priorities. Notes: Arizona’s income tax cuts will be phased-in over two years.
Iowa’s income tax cuts for seniors will be phased-in over eight years, reaching their largest impact of $118 million in 2015.
In Michigan, the Single Business Tax will be repealed January 1, 2008. The legislative committee is scheduled to recommend a plan to replace this lost revenue by December 1, 2006. The EITC is phased in over two years. Effective Jan 1, 2008, the state EITC is equal to 10 percent of the federal EITC; effective Jan 1, 2009, the state EITC is equal to 20 percent of the federal EITC. The 2008 cost shown here is three-fourths of the total revenue from the SBT (since the repeal takes effect one-quarter of the way into the fiscal year) plus the 2008 EITC impact as estimated by the Michigan Senate Fiscal Agency.
The North Carolina impacts shown here reflect the impact of reducing sales taxes and income taxes relative to the budget impact of not repealing them at all. |
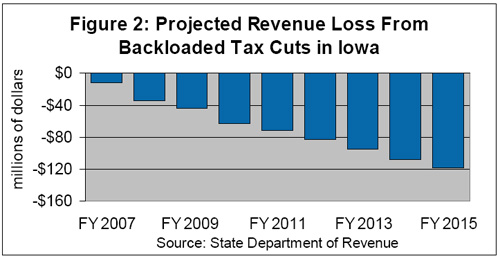
- Iowa enacted a tax cut for middle- and upper-income senior citizens that is projected to have a minimal impact on the FY 2007 budget, but will cost the state $34 million in 2008, $44 million in 2009, $63 million in 2010, and continually increasing amounts until 2015, when the tax cut will be fully phased-in and the state will lose $120 million per year (See Figure 2).
- Michigan is repealing its “single business tax” effective January 1, 2008, and enacting a state EITC that phases in over tax years 2 008 and 2009. The business tax currently raises $1.9 billion per year, so its repeal likely will cost the state about three-quarters of that amount or $1.43 billion in fiscal year 2008 and the full $1.9 billion in fiscal year 2009. (Michigan’s fiscal year, unlike those in most other states, runs from October 1 to September 30.) The EITC is estimated to cost slightly less than $100 million in fiscal year 2008, rising to about $250 million in fiscal year 2010.[2] Legislative leaders have appointed a panel to come up with replacement revenue for the business tax, but they are not expected to make recommendations until the end of this year. It is unclear whether the “replacement revenue source” will, in fact, fully replace the Single Business Tax’s revenue.
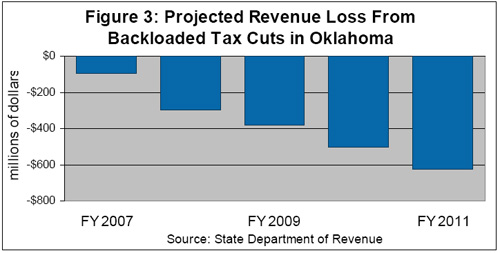
- In Oklahoma, a package of income tax cuts will reduce state revenue by an estimated $95 million in fiscal year 2007 — an amount equal to 1.4 percent of state tax revenue, already a significant sum. But the enacting legislation calls for far deeper tax cuts in future years. By 2011, the tax cuts are expected to have a price tag of $628 million, more than six times the 2007 figure and nearly one-tenth of the state’s total tax revenue (See Figure 3).
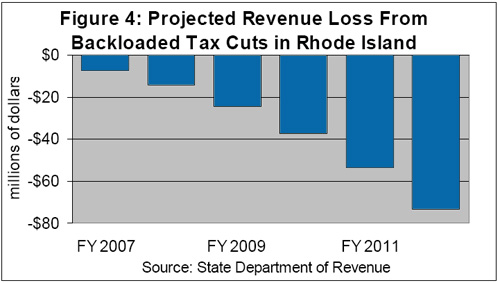
- In Rhode Island, lawmakers designed an income tax cut principally for high-income taxpayers that will cost the state $7 million in fiscal year 2007 but will rise to $73 million in 2012 – a ten-fold increase (See Figure 4).
The pattern of backloaded tax cuts has one significant exception. Wyoming’s 2006 tax cut, a reduction in the sales tax on food, was fully implemented in the current fiscal year and therefore fully accounted for in the state budget. Moreover, Wyoming enacted its tax cut on a temporary basis, so it will expire when the current budget period ends on June 30, 2008. Policymakers will be able to decide whether to extend the tax cut when they consider the next biennial budget. In other words, Wyoming fully accounted for the cost of its tax cut — the only state to do so among the ten.
|
If Backloaded Tax Cuts Are Dangerous, How Did New Mexico Accommodate Its Backloaded Tax Cut of 2003?
In 2003, as most other states were struggling to balance their budgets and in many cases increasing taxes or other new revenues, New Mexico enacted a large reduction to its personal income tax. Like other states’ 2006 tax cuts described in this paper, New Mexico’s 2003 tax cut was backloaded. The tax cut cost New Mexico only $24 million in tax year 2003. But it was designed in such a way that the fiscal impact would rise sharply in the out-years, costing the state $90 million in 2004, $185 million in 2005, $307 million in 2006, and $400 million in 2007 — an amount equal to 8.3% of total tax revenue, according to current projections from the state’s Department of Tax and Revenue.
Not surprisingly, the tax cut has put a severe crimp in the state’s personal income tax collections. New Mexico’s 2006 personal income tax receipts in 2006 grew just 2.2 percent, less than the rate of inflation. Similarly slow growth in New Mexico’s income tax is forecast for 2007 and 2008.
Fortunately for New Mexico, the state has experienced much less fiscal hardship as a result of the tax cuts than might have been expected. There is one simple reason for this: New Mexico derives much of its state revenue from oil and gas receipts, and the rise in oil and gas prices has rapidly increased that revenue. When the personal income tax cuts were enacted in 2003, oil cost about $31 per barrel and the state received $552 million from severance taxes and mineral leasing; oil now costs $70 per barrel and the state expects to receive over $1 billion in direct oil and gas revenue in FY 2007. The state’s corporate income tax, a substantial share of which is paid by oil and gas companies, has also increased. These increases have produced more than enough revenue to offset the personal income tax cuts and allow the state to continue to balance its budget.
It appears that as long as oil and gas prices continue to rise, New Mexico can continue to finance the personal income tax reductions. Should oil and gas prices fall (which they have already begun to do), however, the state may need to rethink those tax cuts.
States without a rapidly rising revenue source, by contrast, may find it difficult to emulate New Mexico’s experience without fiscal hardship. Tempting as it may seem to use New Mexico’s experience as a tax-cut template, the unusual structure of the state’ revenue system makes it irrelevant for nearly any other state. |
Backloaded Tax Cuts May Be Politically Beneficial but May Cause Fiscal Problems
Enacting a tax cut that has all or most of its fiscal impact in a future budget year has undeniable appeal to lawmakers, particularly those seeking re-election this fall: it enables them to claim credit for tax cuts without having to write a budget that includes their full cost. This strategy may have particular appeal this year because it is the first election year since states’ revenues have begun to recover strongly.[3]
But for education, health care, transportation, public safety, and other services financed by state taxes, such a maneuver is risky. When the growth in the cost of implementing future phases of backloaded tax cuts is projected to exceed economic growth, it is clear that future year services will have to be cut more deeply. Backloaded tax cuts enable legislators to pass cuts now without specifying what services will be foregone in the future. Further, due to annual budgeting or biennial budgeting that ends in FY 2007, most states have not budgeted ahead of time for these backloaded tax cuts and may be unable to pay for them when the bill comes due.[4] Revenue loss, particularly loss that is severely backloaded, is likely to cause problems in at least some states in future years for several reasons.
- Backloaded tax cuts are hazardous to fiscal health. Passing tax cuts whose largest impact is several years into the future restricts legislators’ ability to meet existing or emerging needs in areas like education, health care, and transportation. Due to balanced budget requirements, state legislators will be forced, now or later, to cut services. In the late 1990s, a number of states enacted similarly backloaded tax cuts. The strategy was successful — for a while. The run-up in the stock market led to an increase in capital gains and a short-term revenue boost for many states, giving the appearance that the tax cuts had been affordable. When the stock market fell and the economy went into a recession, however, states that had enacted large tax cuts suffered the most. Their deficits were larger, budget cuts were deeper, and subsequent tax increases were greater than those of states that did not enact large tax cuts.[5]
- States continue to struggle to restore their budgets to pre-recession levels. Despite substantial growth in FY 2007 budgets, a recent Center on Budget and Policy Priorities survey finds that nationwide, state General Fund Spending remains lower than pre-recession levels. This suggests that many states have not made up for the cuts in health care, education, and other areas that they enacted during the recession and its aftermath. Of the ten states enacting substantial tax cuts in 2006, five — Iowa, Michigan, Nebraska, Oklahoma, and Utah — did so even though their FY 2007 General Fund budgets remain below 2000 levels as a share of the economy.
- Although state revenue growth has been strong in the last two years, it is unlikely that revenue growth will remain high. Indeed, even without tax cuts, most states in the coming years are likely to experience slower revenue growth than would be necessary to provide a constant level of public services. This is because most states’ revenue systems are heavily dependent on revenue sources that do not keep pace with changing economies.[6] For example, state corporate taxes have raised less state revenue over time as businesses began to operate across numerous states, making it difficult to measure profits, and thus the appropriate level of tax payments, in any one state. Revenue from sales and excise taxes has also lagged behind economic growth. Sales tax revenues have declined over time as consumption shifted from taxable goods to tax-exempt services. The emergence of interstate and internet sales has exacerbated this problem since it is difficult for states to monitor and tax these sales. Sin tax revenue has also declined; raising a cigarette tax temporarily raises revenue, but eventually causes smokers to smoke less, causing revenues to fall.
At the same time, states are likely to face rising costs associated with health care, education, and other public services. A well-designed revenue structure could cover those costs, but an inadequately designed revenue system — particularly one further weakened by tax cuts whose costs grow over time — cannot.
|
What About the Tax “Swaps” and Tax Increases of 2006?
In addition to the ten states that, as described in this paper, enacted major tax cuts, four other states made changes to their tax codes that will have significant fiscal impacts at the state level. Idaho, South Carolina and Texas raised taxes in order to help finance state-mandated property tax reductions at the local level – in effect, “tax swaps” that actually are projected to cost the state more than they bring in. New Jersey also increased sales and cigarette taxes at the state level.
- The Idaho “swap” raises $219 million per year by increasing the sales tax rate from 5 percent to 6 percent, and cuts local school property taxes by $260 million per year. The state is spending all of the new revenue from the sales tax increase, plus additional general funds, to compensate the local districts for nearly all of the revenue loss resulting from the property tax cut. (An additional $100 million from the budget surplus is being used to create a Public Education Stabilization Fund, a rainy day fund just for K-12 education.) Because the sales tax increase did not raise enough funds to cover the loss of property tax revenue, it is unclear how school funding will be maintained in the future.
- The South Carolina package, which mostly takes effect in fiscal year 2008, raises state taxes by an estimated $450 million a year in 2008, cuts local property taxes by about $500 million per year, and increases state aid to local school districts by $527 million per year.
- The Texas package raises state business and cigarette taxes by slightly more than $4 billion per year but is projected to reduce local school property taxes by more than twice as much, roughly $9 billion to $10 billion per year over the next several years. The legislature has committed to recompense local governments for the lost property tax revenue, but it is unclear how it can do so without budget cuts, large drains on reserves, or additional new revenue sources.
- New Jersey’s $1.6 billion annual tax increase includes a 1-cent sales tax rate increase, a broadening of the state sales tax base to include more services, and a cigarette tax increase. Policymakers have committed to devoting part of the new revenue to local property tax relief but have not yet enacted the relief. The remainder of the revenue will be used to help address a variety of budget problems, including a recurring budget deficit, an under-funded pension plan, and rising health care costs.
|
Conclusion
The 2006 state tax cuts are like a layaway purchase by a fiscally overextended consumer: they are appealing now, but are likely to prove unaffordable in the future. Just as the state tax cuts of the 1990s helped create the difficult fiscal conditions of the early 2000s, states that cut taxes in 2006 may well be creating future problems for themselves. Since most of the tax-cutting states lack plans to replace these lost revenues, these states may also be forced to cut services or make other unpalatable decisions in future years. Instead of purchasing tax cuts on layaway, states would be better off purchasing only the cuts they can afford now, without jeopardizing future public services.
End Notes:
[1] Excluded from this analysis are reductions in local property taxes, even when they are state-mandated and/or state-funded, such as a major increase in homeowner rebates in New York and elimination of a portion of property taxes that equalize state funding for education in Arizona. At least some of these property tax reductions, such as a gradual reduction in property tax assessment caps in Rhode Island that will take full effect in 2012, are backloaded in much the same way as the state tax cuts that are discussed in this analysis. They are excluded here because of the complexities involved in comparing state property tax and school-funding systems. Property tax reductions enacted in Idaho, South Carolina, and Texas are discussed in the box on page 8 in the context of state-level tax increases that paid for them.
[2] The Michigan House and Senate fiscal offices have different estimates of EITC cost in 2008 and 2009, and estimates for 2010 are not available. A review of Internal Revenue Service data suggests that the Michigan EITC will cost $250 million in 2010.
[3] In recent years, federal policymakers have used similar strategies to give a misleadingly modest appearance to tax cuts that in reality are prohibitively expensive. See, for example, https://www.cbpp.org/5-9-06tax-fact.htm
[4] Some states do prepare multi-year forecasts of spending and revenues, but do not require that these forecasts are balanced; in Rhode Island, for instance, the five-year forecast showed illegal deficits even before these tax cuts were enacted.
[5] For more information on tax cuts in the 1990s, see Tax Cuts and Consequences: The States That Cut Taxes the Most in the 1990s Have Suffered Lately, Center on Budget and Policy Priorities, January 12, 2005. Available at https://www.cbpp.org/1-12-05sfp.htm.
[6] For more information on structural deficits, see Faulty Foundations: State Structural Budget Problems and How to Fix Them, Center on Budget and Policy Priorities, May, 2005. Available at https://www.cbpp.org/5-17-05sfp.pdf. |