
DEFICIT PICTURE GRIMMER THAN NEW CBO PROJECTIONS SUGGEST
By
Richard Kogan,
David Kamin, and
Joel Friedman
| PDF of analysis |
|
| If you cannot access the files through the links, right-click on the underlined text, click "Save Link As," download to your directory, and open the document in Adobe Acrobat Reader. |
Summary
On January 26, the Congressional Budget Office issued new budget projections that show the federal government running a large cumulative deficit over the next ten years. As CBO acknowledges, however, its baseline projection is unrealistically optimistic, since it does not include the costs of continuing various policies, such as the recent tax cuts.[1] Omitted costs that are likely or virtually certain to be incurred exceed $3.3 trillion. Adjusting the CBO baseline for such costs raises the deficit projection to $5.2 trillion over the next ten years. Other analysts, such as economists at the Brookings Institution and Goldman Sachs, have also projected that deficits will exceed $5 trillion over the decade.
This analysis explains why — and to what extent — the budget picture is grimmer than the CBO projections may suggest. It also examines new CBO data that shed light on the causes of the sharp fiscal deterioration of recent years. These data indicate that among actions policymakers have taken, tax cuts have added the most to the deficits.
|
Key Findings
|
Key findings of the analysis include:
- The new CBO ten-year projections understate the likely size of future deficits because they do not reflect the costs of continuing various policies currently in effect; for example, the CBO baseline assumes that all of the tax cuts enacted since 2001 will expire. The baseline also assumes that relief from the Alternative Minimum Tax will end, and the number of tax filers subject to the AMT will rise from three million today to 29 million by 2010.
- The new CBO report projects deficits totaling $1.9 trillion over the ten-year period from 2005 through 2014. A more realistic assessment — one that uses CBO estimates but incorporates likely or inevitable costs, following the same methodology that was used in the September 2003 report by the Committee on Economic Development, Concord Coalition, and the Center on Budget and Policy Priorities — shows a ten-year deficit of $5.2 trillion.
- Under these assumptions, the national debt climbs from $4.0 trillion today to $9.7 trillion by the end of 2014 (reflecting the $5.2 trillion in deficits for the 2005 – 2014 period, plus the nearly $500 billion deficit in 2004). Debt rises from 33 percent of Gross Domestic Product in 2001 to 54 percent of GDP by 2014.
- Under the more realistic assessment, the deficit exceeds $400 billion in every year and stands at about $477 billion in 2009, the year in which the President has said that the deficit would be cut in half. The $477 billion figure is essentially identical to the projected 2004 deficit, indicating little progress toward the Administration’s goal of halving the deficit. Furthermore, by 2014, under these more realistic assumptions, the deficit reaches $708 billion.
- The data show that the large deficits projected for the coming decade are more a reflection of a historically low level of revenues, measured as a share of the economy, than of an unusually high level of federal spending. In 2004, revenues will total only 15.8 percent of GDP under current law, the lowest level since 1950. Although revenues will rise as the economy recovers from the recession, they still will average only 17.1 percent of GDP over the coming decade (2005 through 2014), assuming the recent tax cuts are extended and AMT relief is continued. That is below the average levels for every decade in the second half of the 20th century.
Federal spending, on the other hand, will average about 20.6 percent of GDP over the next 10 years, assuming enactment of all likely expenditures reflected in the more realistic ten-year deficit projection. This is lower than the level of federal spending in every year from 1980 through 1995.
Tax Cuts Are The Single Largest Way Policymakers Have Increased Deficits
In January 2001, CBO projections showed surpluses over the ten-year period from 2002 through 2011 totaling $5 trillion. (This figure has been adjusted down from the official $5.6 trillion CBO 2001 estimate to include likely or inevitable costs that were left out at that time, thereby making the 2001 projection comparable methodologically to our current projections; see box on page 6.) Our current estimate of this same ten-year period shows cumulative deficits of $4.3 trillion, for a total deterioration of $9.3 trillion over the ten-year period 2002 to 2011. (This $4.3 trillion figure differs from the $5.2 trillion cumulative deficit cited above, because the latter figure covers the years 2005-2014.)
What caused a projected surplus of $5 trillion to become a projected deficit of $4.3 trillion? Approximately 35 percent of this stunning $9.3 trillion deterioration is due to the tax cuts enacted over the past three years or assumed in this analysis, making tax cuts the single largest factor attributable to policymakers’ actions. Another 28 percent of the deterioration is due to spending legislation, with more than two-thirds of the growth in spending representing increased costs for defense, homeland security, and the war on terrorism (and only one-twenty-fifth of the new spending representing increased costs for domestic discretionary programs outside homeland security). The remainder of the deterioration stems from the view CBO now holds that the economic and technical underpinnings of its 2001 projection were too rosy.
Continuing Large Deficits Harm The Economy
The deficits we project — which will only grow larger when the baby boomers begin to retire at the end of the decade — pose a threat to the long-term health of the economy. Persistent large deficits tend to reduce national saving, crowd out private investment, and slow economic growth. In addition, former Treasury Secretary Robert Rubin and several economists recently warned that the projected long-term budget imbalances have become so large that they ultimately could lead to serious “financial and fiscal disarray” and cause a “fundamental shift in market expectations and a related loss of confidence at home and abroad.”[2]
CBO’s 10-year Projections Do Not Reflect Several Trillion Dollars in Likely Costs
|
CBO Projections Do Not Include Likely Costs, 2005-2014 (In trillions of dollars) |
|
|
CBO January Projections |
$1.9 |
|
Tax Cut Extension |
$2.2 |
|
AMT Relief |
$0.7 |
|
Defense and International Spending |
$0.4 |
|
Other Domestic Appropriations |
$0.0 |
|
Resulting Deficit Projections |
$5.2 |
|
May not add due to rounding; figures include associated interest costs |
|
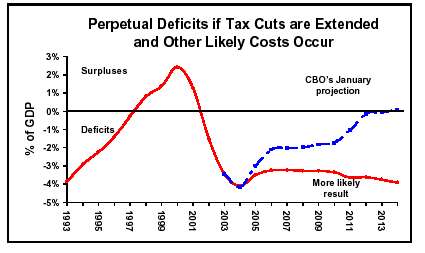
Under CBO’s official baseline projection, large deficits in 2004 will be followed by falling deficits and then by a small budget surplus in 2014. Over the ten-year period from 2005 through 2014, the sum of CBO’s projected deficits and surpluses nets to a cumulative deficit of $1.9 trillion. CBO’s projections imply steadily improving budgets after 2004.
But as is widely recognized, this projection is unrealistic. It omits an estimated $3.3 trillion in costs over the next ten years that result from legislation Congress and the President are likely — and in many cases, virtually certain — to enact.[3]
- Enactment of the 2001, 2002, and 2003 tax cuts has filled the tax code with tax-reduction measures that are scheduled to expire between 2004 and 2010. If Congress makes all expiring tax cuts permanent — and there will be strong pressure to do so — CBO estimates that the projected ten-year deficits will increase by $2.2 trillion (including the added interest payments on the debt).
- In addition, while three million tax filers will be subject to the Alternative Minimum Tax in 2004, that figure is set to explode in coming years unless current AMT relief — which expires at the end of 2004 — is continued. Continuation of that relief — a near-certain event — would increase the ten-year deficit by at least another $658 billion. This figure, which includes the associated interest costs, reflects CBO’s estimate of the cost of extending AMT relief.[4]
-
On net, the baseline
understates defense and international costs. On the one hand, it
overstates certain costs by mechanically repeating in all future years
last fall’s $87.5 billion supplemental appropriation bill that funded
operations in
CBO does not include any of these various costs in its projection because it follows mechanical rules that permit the inclusion only of tax and entitlement provisions that have already been enacted as well as funding levels for discretionary (i.e., non-entitlement) programs — including defense, international, and homeland security programs — that equal current levels adjusted only for inflation. Adding likely or inevitable costs raises the projected deficits to $5.2 trillion over the next ten years. (See Table 1, on page 3. For further details, see Appendix A.)
Other analysts have reached similar conclusions about likely deficits. For example, Brookings economists estimate the deficits at $5.5 trillion over the ten years from 2005-2014.[5] (Their estimate is modestly larger than the one presented here, primarily because it includes a somewhat larger cost for AMT relief.) Deficit estimates from Wall Street firms such as Goldman Sachs are similar as well.
This projection of $5.2 trillion in cumulative deficits over the next ten years includes $2.4 trillion in surpluses in the Social Security trust funds. Outside of Social Security, the projected ten-year deficits total $7.6 trillion.
Administration to Use Gimmicks to Achieve Goal of Cutting Deficit in Half by 2009
These projections contradict Administration claims that deficits, as a share of the economy, will be cut in half in five years. The President’s budget, to be released February 2, is likely to meet this self-constructed goal, but it will do so only by leaving out about $200 billion in likely costs in 2009, the fifth year.
Specifically, the OMB figures are likely to exclude the costs of extending relief from the mushrooming Alternative Minimum Tax after 2005; to omit the costs after 2005 or 2006 of extending a series of very popular tax breaks that come up for renewal every couple of years and always are extended; to leave out the costs of fighting terrorism internationally after September 30, 2004; and to fail to reflect the full costs of the Administration’s own “Future Year Defense Plan.” [6]
In this regard, the Administration’s budget for years after 2005 is likely to be something of an exercise in fiscal fantasy. Instead of being cut in half over the next five years, the deficit is likely to hold steady at above 3 percent of GDP through 2010, and from there to rise to approximately 3.9 percent of GDP by 2014 and higher levels in subsequent years.
How Did These Deficits Come About?
In January 2001, CBO’s baseline projection showed surpluses totaling $5.6 trillion over the ten-year period 2002-2011. Since that time, the budget world has turned on its head. Over the same ten-year period, deficits now are expected to total $4.3 trillion.
From a $5.6 trillion surplus to a $4.3 trillion deficit is a swing of $9.9 trillion. On a comparable basis, the deterioration is $9.3 trillion, however, rather than $9.9 trillion (see box on page 6). A deterioration of $9.3 trillion in the budget outlook over a period of 36 months is remarkable. Of this $9.3 trillion drop, 37 percent is due to economic and technical reestimates. The most important legislative factor is the tax cuts, accounting for 35 percent of the $9.3 trillion deterioration. Spending increases enacted by Congress and the President are responsible for the final 28 percent of the shift from surpluses to deficits.
|
Comparable Projections In January 2001, CBO projected a $5.6 trillion surplus over the ten-year period 2002-2011. To use that projection as a basis for comparison with the current projection, we need to make sure that both projections are made on a comparable basis. Since we have incorporated certain likely or inevitable costs into the current deficit projection, similar costs also must be incorporated into CBO’s January 2001 projection before the projections can be compared. Doing so reduces the surpluses reflected in the January 2001 projection by about $600 billion. After making these adjustments for comparability purposes, the difference between the surpluses projected in January 2001 for the 2002-2011 period and the deficits we now project for those years is $9.3 trillion. |
Reestimates. Economic and
technical assumptions account for nearly $3.4 trillion of the fiscal
deterioration since January 2001. The economic and technical
assumptions that CBO employed in January 2001 have proven too
optimistic. In January 2001, CBO did not foresee the recession that
was a few months off. The recession is significant primarily in the
short term, however; the larger problem is with CBO’s “technical
assumptions.” In particular, CBO now believes that its January 2001
projections significantly overstated the level of tax revenues that the
Tax legislation. Tax cuts account for $3.3 trillion of the $9.3 trillion deterioration for the years 2002-2011, making them the most costly legislative change since 2001. Moreover, the share of the fiscal deterioration that is attributable to tax cuts rises over time. By 2014, tax cuts will account for 40 percent of the deterioration.
Defense, Homeland Security, and International Affairs. Since 2001, new funding in the areas of defense, homeland security, and international affairs has accounted for more than two-thirds of all legislated spending increases. Of the $9.3 trillion fiscal deterioration, $1.8 trillion — or about 20 percent — comes from increases in funding for these areas.[7]
Prescription drugs and other entitlement legislation. Enacted entitlement increases, including the new Medicare prescription drug benefit, account for $663 billion — or 7 percent — of the $9.3 trillion deterioration. The lion’s share of this amount is for the prescription drug benefit. The enacted entitlement increases also include the farm bill, the first airline bailout, compensation for victims of the terrorist attacks, two temporary provisions for extended unemployment benefits, temporary state fiscal relief, two bills increasing payments to Medicare providers, and legislation increasing benefits for certain categories of veterans.
|
The Projected
$9.3 Trillion Deterioration
May not add due to rounding; all figures include associated interest costs. |
Domestic Appropriations other than Homeland Security. A final $111 billion — or 1 percent — of the deterioration is due to increases in domestic “discretionary” programs other than homeland security. This amount is less than one-sixteenth the increase in costs for defense, homeland security, and international programs.
Although substantial, the increase in spending caused by Congressional actions is considerably smaller than the loss of revenues that has resulted from the tax cuts. In recent months, some have blamed current federal deficits on “exploding” spending. The budget data contradict such claims. The cost of the tax cuts is nearly 25 percent larger than the cost of spending legislation over the 2002-2011 period.
Furthermore, the economic and technical reestimates are almost entirely downward revisions in revenues. Combining the tax cuts and the downward revisions in revenues, Table 3 shows that 79 percent of the $9.3 trillion deterioration — or $7.3 trillion of the total — reflects a decline in revenues plus the associated interest costs. Only $1.9 trillion, or 21 percent, of the deterioration reflects an increase in spending. The drop in revenues has thus been nearly four times as important as the increase in spending in explaining the large shift from surpluses to deficits.
Revenues At Historic Lows Over the Decade
This dramatic drop in federal revenues has left them at historic lows. Over the coming decade, revenues measured as a share of the economy will remain well below their modern average. Spending, on the other hand, will be near its recent historical norm as a share of the economy. This decade thus will feature large deficits stemming from unusually low revenue levels, coupled with spending levels that are normal in historical terms.
|
The Projected
$9.3 Trillion Deterioration
May not add due to rounding; all figures include associated interest costs. |
Table 4 compares the spending and revenue levels for the coming decade to the levels during the previous business cycle, 1989 through 2000. The 1989 – 2000 period covered both good times and bad; more significantly, those were years of greater fiscal discipline.
- Table 4 shows that the average level of revenues over the next ten years is expected to be 17.1 percent of GDP. This is 1.6 percent of GDP lower than the average for 1989 – 2000. As the table also shows, this drop in revenues accounts for all of the difference between average deficits during the 1989 – 2000 period and the deficits now projected for the next ten years.
- The 17.1 percent average revenue level is low compared not only with levels in the 1989 – 2000 period but also with average revenue levels during the entire second half of the 20th century. The average revenue level projected for the next ten years, measured as a share of the economy, is lower than the average revenue levels for the 1950s, 1960s, 1970s, 1980s, and 1990s.
- Revenues will remain at historically low levels even after a full economic recovery. In 2014, revenues are projected to reach 17.5 percent of GDP. This still will be below the average revenue levels for all post-war decades except the 1950s.
- In contrast, despite the increases in spending for defense and certain other programs that are built into our more realistic projections, spending from 2005 through 2014 will average 20.6 percent of GDP. This is directly in line with the average level of spending from 1989 through 2000.
- The average spending level that we project, measured as a share of the economy, is lower than the spending levels for every year from 1980 through 1995.
|
As a Share of GDP
May not add due to rounding |
By the end of this decade, the aging of the population and continued increases in health care costs will drive up spending for Social Security, Medicare, and Medicaid, and total outlays will rise to historic levels. If that increase in spending is coupled with the continuation of historically low revenues, as is projected, the nation will face even larger deficits. This upsurge in spending is still some years away, however, and the story of this decade’s deficits — and of the dramatic turnabout of the past three years — is more about falling revenues than rising spending.
Implications for the Nation’s Economic Health: Rising Debt and Slower Growth
By the end of the decade, the first of the baby-boomers will have reached retirement age. Deficits are projected to rise substantially in the years that follow. The costs of Medicare, Medicaid, and Social Security will grow faster than the economy and the nation’s revenue base. By running large deficits in the years before the baby boomers retire, the country is squandering the opportunity to prepare for this major demographic change.
If the debt were to decrease substantially during the coming decade — as it was on course to do only a few years ago — the federal government could avoid hundreds of billions of dollars a year in interest payments every year in the future. Had we continued to adhere to policies to shrink the debt over this decade, we would largely have eliminated the cost of one of the biggest and most wasteful of federal programs — interest payments on the debt.
Three years ago, net interest payments on the debt were projected to disappear before the end of the decade as the debt shrank to zero. Now, under our projections, the debt will reach $9.7 trillion in 2014, or almost 54 percent of GDP. This is a major increase from 2001, when debt was 33 percent of GDP. As a result, interest payments on the debt are projected to rise significantly.
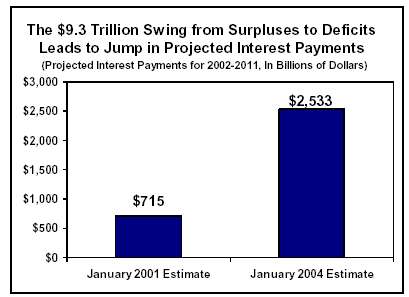
For instance, in January 2001, interest payments were projected to be $715 billion over the 2002 to 2011 period; today, we estimate that interest payments will total $2.5 trillion for that same ten-year period, a more than three-fold increase. Over the ten years from 2005 to 2014, interest payments are estimated to total $3.4 trillion. By 2014, interest payments are projected to consume $486 billion a year and eat up 13 percent of the federal budget. That will make it harder to fund programs like Social Security, Medicare, and Medicaid without running massive deficits.
T
he projected deficits also pose risks to the nation’s long-term economic health. Higher deficits reduce national saving and thereby result in less domestic investment (and more borrowing from overseas). Expectations of persistently high future deficits also can raise long-term interest rates. Such outcomes lower the nation’s future income and standard of living.
The large long-term deficits that the
Similarly, a
new analysis by former Treasury Secretary Robert Rubin, Brookings
Institution economist
Conclusion
CBO now projects cumulative deficits of $1.9 trillion over the next ten years. But as CBO notes, this projection is based on a mechanical formula that leaves out various likely costs. Adjusting for the extension of the tax cuts, continuation of AMT relief, and full funding of the Administration’s defense plan, among other costs, brings the ten-year cumulative deficit to $5.2 trillion.
This represents a fiscal sea change from three years ago. In 2001, surpluses were projected through the end of the decade, and the federal debt was expected to disappear. Now, unsustainably large deficits loom as far as the eye can see.
The single largest legislative factor in explaining this dramatic shift from surpluses to deficits is the tax cuts. This year, revenues are expected to represent 15.8 percent of GDP, the lowest level since 1950. Even after the economy recovers, revenues will be lower, as a percentage of the economy, than the average revenue levels for the 1960s, 1970s, 1980s, or 1990s.
When the baby-boomers begin to retire at the end of the decade, the federal government will face even more difficult fiscal times. Spending will rise to historically high levels as the aging of the population and continued increases in health care costs drive up costs for Social Security, Medicare, and Medicaid. In short, if we remain on our current policy course, revenues will remain at unusually low levels while expenditures grow to historically high levels. The large imbalance between revenues and spending that lies ahead threatens to produce dangerously large deficits.
The story of this decade’s deficits and of the dramatic turnabout of the past three years, however, is more about falling revenues rather than rising spending. By running large deficits over this decade, federal policymakers are missing an opportunity to help prepare for the baby boomers’ retirement and to place the nation on firmer fiscal and economic footing for the long term.
Appendix A
The
CBO Baseline and What It Does Not Include
CBO’s official baseline estimates are a projection of future expenditures and revenues, calculated according to a rigid set of rules under which the baseline reflects current law as it is scheduled to apply in future years. CBO’s official projections thus assume, for example, that all of the tax cuts scheduled to expire will terminate on schedule.
These projections are the basic benchmark against which analysts routinely assess the costs of proposed and actual changes in law. These projections do not necessarily provide a realistic assessment, however, of the future fiscal outlook, and are not intended to do so. Because of the rules on which they are based, the CBO projections present a much rosier picture of the future than is likely to occur.
In the past, when the significance of scheduled expirations of tax cuts was trivial, the budget baseline functioned both as a benchmark against which to measure the cost of legislation and as a plausible predictor of future deficits. It no longer does the latter. As former CBO Director (and current Urban Institute President) Robert Reischauer has remarked, “Rarely have the policies underlying the baseline projections been as disconnected from the policy makers’ agendas as they are today.”[10]
The official
CBO projections are unrealistically rosy for two essential reasons.
First, they omit the costs of extending the 2001 and 2003 tax cuts
beyond their scheduled expiration dates, providing relief from the
mushrooming alternative minimum tax, and extending various tax breaks
that are scheduled to expire but that Congress always renews. Second,
they understate costs for appropriated programs, especially in the
areas of defense, homeland security, and the occupation and
reconstruction of
Likely or Inevitable Costs Not Reflected in the CBO Baseline
The adjustments to the CBO baseline made for this analysis, and discussed below, are consistent with the methodology followed in developing the deficit projections that the Committee for Economic Development, the Concord Coalition, and the Center on Budget and Policy Priorities jointly released in September 2003.[11]
Extending the 2001 and 2003 tax cuts: CBO’s projections assume the entire 2001 tax cut will expire on schedule in 2010. Few observers believe this will occur.
|
Adjustments to CBO Deficit
Projections |
|||||||||||
|
|
2005 |
2006 |
2007 |
2008 |
2009 |
2010 |
2011 |
2012 |
2013 |
2014 |
Total |
|
CBO January 2004 projections |
-362 |
-269 |
-267 |
-278 |
-268 |
-261 |
-162 |
-24 |
-16 |
13 |
-1,893 |
|
Tax cut extension |
-57 |
-115 |
-124 |
-125 |
-131 |
-141 |
-274 |
-389 |
-419 |
-455 |
-2,230 |
|
AMT relief |
-9 |
-26 |
-34 |
-43 |
-55 |
-69 |
-82 |
-95 |
-112 |
-134 |
-658 |
|
Defense & international |
2 |
-9 |
-7 |
-11 |
-22 |
-34 |
-53 |
-81 |
-87 |
-106 |
-410 |
|
Domestic discretionary |
5 |
8 |
6 |
3 |
0 |
-4 |
-9 |
-13 |
-19 |
-25 |
-47 |
|
Resulting deficit projections |
-420 |
-410 |
-426 |
-454 |
-477 |
-509 |
-580 |
-602 |
-654 |
-708 |
-5,239 |
|
Resulting deficit projections as a percent of GDP |
-3.5% |
-3.2% |
-3.2% |
-3.3% |
-3.3% |
-3.3% |
-3.7% |
-3.6% |
-3.8% |
-3.9% |
-3.5% |
|
Notes: Negative values indicate deficits or costs that increase deficits. Positive values reflect surpluses or policies that reduce deficits. All figures include both the policy’s direct costs and the additional interest costs it generates. |
|||||||||||
The 2003 tax cut, which was enacted in May 2003, was advertised at the time as costing $330 billion through 2013. (The measure also included $20 billion of fiscal assistance to the states, bringing the total official cost to $350 billion.) The official cost of the tax cuts was held to $330 billion, however, only because eight of the nine tax-cutting provisions in the legislation were written so those provisions would expire in 2004, 2005, or 2008. If these “artificial sunset dates” are removed and the tax cuts remain in place — a likely occurrence given that the President and Congressional Leadership seem intent on extending most or all of these provisions — the costs of the 2003 tax-cut legislation will exceed $1 trillion through 2014.
Combining the costs of extending the 2001 tax-cut law after 2010, the removal of the artificial sunsets in the 2003 tax-cut law, and the routine extension of a number of expiring tax breaks that are slated to expire every few years and always are extended with strong bipartisan support results in a total of $1.9 trillion in likely revenue losses that are not reflected in the CBO baseline. This $1.9 billion figure is CBO’s own and is reflected in its new budget report. When the added interest costs are included, these tax-cut extensions add $2.2 trillion to CBO’s 10-year deficit projection, as Table A-1 indicates.
The Alternative Minimum Tax: The provisions of current law that prevent the Alternative Minimum Tax from affecting large numbers of middle-class taxpayers are scheduled to expire at the end of 2004. There is little question such relief will be extended. Without it, the number of taxpayers subject to the AMT will explode from about 3 million today to 44 million by 2014, assuming the 2001 tax cut is extended past its 2010 expiration date. Observers consider continuation of AMT relief a virtual certainty, and the Administration has said it plans to address the AMT issue in 2005. CBO estimates that the cost of limiting the growth of the AMT by extending the current relief and indexing the AMT exemption and tax brackets to inflation equals $658 billion through 2014, including interest costs.[12] (See Appendix B for further discussion of the AMT issue.)
|
Differences
Between the 2001 CBO Projections (Adjusted for Comparability) |
||||||||||||
|
|
2001 |
2002 |
2003 |
2004 |
2005 |
2006 |
2007 |
2008 |
2009 |
2010 |
2011 |
2002-2011 Totals |
|
CBO’s 2001 surplus projection (adjusted for comparability) |
281 |
307 |
346 |
374 |
398 |
458 |
512 |
556 |
611 |
673 |
741 |
4,977 |
|
Economic reestimates |
-27 |
-120 |
-124 |
-76 |
-45 |
-35 |
-47 |
-58 |
-62 |
-70 |
-86 |
-723 |
|
Technical reestimates |
-42 |
-201 |
-246 |
-276 |
-269 |
-261 |
-261 |
-270 |
-287 |
-298 |
-294 |
-2,662 |
|
Tax cuts, incl. extensions and AMT relief |
-75 |
-82 |
-192 |
-283 |
-286 |
-315 |
-347 |
-376 |
-402 |
-444 |
-530 |
-3,258 |
|
Defense, homeland security, & international |
-5 |
-42 |
-104 |
-150 |
-167 |
-189 |
-196 |
-211 |
-232 |
-256 |
-292 |
-1,838 |
|
Domestic appropriations except homeland security |
3 |
-5 |
-11 |
-16 |
-12 |
-9 |
-11 |
-11 |
-11 |
-14 |
-11 |
-111 |
|
Rx drug benefits and other entitlements |
-8 |
-15 |
-44 |
-46 |
-38 |
-59 |
-75 |
-85 |
-93 |
-100 |
-108 |
-663 |
|
Subtotal: changes from 2001 projection |
-154 |
-465 |
-721 |
-845 |
-818 |
-868 |
-937 |
-1,010 |
-1,087 |
-1,182 |
-1,321 |
-9,256 |
|
Resulting deficits |
127 |
-158 |
-375 |
-471 |
-420 |
-410 |
-426 |
-454 |
-477 |
-509 |
-580 |
-4,279 |
|
Notes: A negative value indicates a deficit or a cost that increases deficits. Positive values reflect policies which create a surplus. All figures include both the policy’s direct costs and the additional interest costs it generates. |
||||||||||||
Defense and International Affairs: CBO’s baseline projections assume discretionary (or non-entitlement) programs will continue to be funded at 2004 levels, adjusted only to cover inflation. As a result, the baseline projections overstate defense costs in some respects and understate them in others.
We produce a
more plausible projection of costs in this area by making several
adjustments. We begin by adjusting the baseline downward by removing
from CBO’s January baseline the mechanical annual repetition of last
fall’s $87.5 billion supplemental appropriation for defense and
international affairs. By repeating the supplemental every year, the
CBO baseline essentially assumes that the occupation of
But the resulting baseline, after removal of this supplemental, is too low for several reasons. First, the baseline does not reflect the full cost of the increases that the Administration’s fiscal year 2004 budget proposes in the structure of the armed forces and the military hardware that the armed forces use. We add to the resulting baseline the amount needed to bring the defense path up to the levels in the President’s budget, as estimated by CBO in March 2003.
Second, CBO has found that the President’s budget itself does not reflect the full costs of the Administration’s multi-year defense plan for weapons and procurement and operations and support. The Pentagon periodically publishes a “Future-Year Defense Plan,” which essentially serves as the Administration’s multi-year defense blueprint. A recent CBO report makes clear, however, that the Administration’s budget underestimates the costs of this plan. In that report, CBO estimates the amount of the shortfall, and the Center on Strategic and Budgetary Assessments has converted CBO’s estimate of the shortfall in funding (or “budget authority”) to a slightly smaller estimate of the shortfall in actual expenditures (or “outlays”). This shortfall is added to the baseline here to reflect likely defense costs.[13]
Finally,
neither the Administration’s fiscal year 2004 budget nor the $87
billion supplemental appropriation bill included costs for the global
war on terrorism — or operations in Iraq and Afghanistan — after
September 30, 2003. CBO assumes the war on terrorism will continue
indefinitely but that the large expenditures for
By backing out the repetition of the October 2003 supplemental and adding likely costs, we find that the CBO baseline understates likely defense and international affairs expenditures by $359 billion. With interest, this adds $410 billion to the projected deficits.
Domestic Appropriations: CBO projects that discretionary funding will grow by enough to keep pace with inflation. For 2005, this is likely to overstate domestic discretionary spending outside homeland security and to understate homeland security expenditures. The Administration is pledging to hold domestic discretionary appropriations outside homeland security to 1 percent nominal growth in its 2005 budget while increasing appropriations for homeland security by 9.7 percent.[14] Although this would mean cuts in real terms in domestic discretionary programs outside homeland security, Congress could adhere to the President’s plan.
In 10 of the last 15 years, however, funding for domestic appropriations has grown faster than inflation plus population growth. Although appropriations might slow in the current budget cycle, it seems likely this historical funding pattern will reassert itself over the course of the decade.
Accordingly, we assume that in 2005 domestic appropriations, outside homeland security, will grow at a 1 percent nominal rate and funding for homeland security will grow 9.7 percent, as the President is apparently requesting. For years after 2005, we assume that total domestic discretionary appropriations — including appropriations for homeland security — will rise with inflation and population growth. This results in projected expenditures for domestic discretionary programs being approximately $47 billion greater over ten years than CBO’s baseline assumes, including interest costs.
In summary, the list of items not included in CBO’s baseline is both lengthy and costly. With interest, it reaches $3.3 trillion over the decade and raises deficits to $5.2 trillion.
It is
possible that some fraction of this $3.3 trillion in added costs might
be avoided. But these estimates also may turn out to be conservative
and to underestimate costs. Our projection assumes no
additional tax cuts over the next ten years. The Administration
and the Congressional Leadership favor additional tax cuts, and a
number of additional tax-cut measures have already passed the House of
Representatives.
Appendix B
The tax-cut
legislation enacted in May 2003 includes a provision to protect taxpayers
from the swelling Alternative Minimum Tax, but only through 2004.
The Administration requested extension of AMT relief in its last budget,
but only through 2005. The New York Times has
quoted Pamela Olson, Assistant Secretary of the Treasury for Tax Policy,
as stating that the Administration plans to propose a long-term solution
to the AMT in the first year of President Bush’s second term. The
article reported, “The target date [for a longer-term AMT proposal] is
2005, she said. ‘We are working on it,’ Ms. Olson said.”
[15] Addressing the AMT problem is clearly part of
Administration and congressional plans. The costs of doing so beyond
2004, however, are not included in the CBO budget projections.
Source of the AMT Problem The Alternative Minimum Tax is a parallel
tax system originally designed to ensure that tax filers with high
incomes do not avoid paying taxes through aggressive use of tax shelters
and other measures. Affected taxpayers calculate their tax
liability under both the regular income tax and the AMT and pay whichever
amount is larger. Unlike the regular income tax code,
however, the key components of the AMT are not indexed for inflation.
As a result, as incomes rise over time with inflation, more taxpayers
become subject to the AMT. This problem was exacerbated by the 2001
tax-cut legislation, which reduced tax liabilities under the regular
income tax code, particularly for people with high incomes, without
making corresponding adjustments in the AMT. About three million taxpayers currently are subject to the AMT. The
By 2014, the AMT will be affecting one of
every three taxpayers in the nation, with many middle-class families
becoming subject to it and its complexities. By that time, the AMT will
be “taking back” a goodly share of the 2001 tax cut from many of these
families. In fact, the
The High Cost of AMT Relief
Revenue-Neutral AMT Relief?
It is possible to prevent most middle
class filers from falling under the AMT without incurring significant
costs. The Tax Policy Center has designed an option to
restructure the AMT in a cost-neutral manner; this option would free
large numbers of middle-class taxpayers from the AMT and offset that
cost by making the AMT tougher on high-income taxpayers who employ
multiple tax breaks — especially taxpayers at very high income
levels, who currently are barely touched by the AMT. Such a proposal
is likely to encounter strong opposition, however, from the
Administration and the Congressional leadership, and is not
considered politically realistic in the current environment. Preventing the individual Alternative Minimum
In addition, the omission of AMT relief
causes the proposal to make the 2001 tax cuts permanent appear to carry a
much lower cost than the proposal actually entails. Official
estimates of the cost of making the tax cut permanent rest upon the
highly unrealistic assumption that AMT relief will end after 2004, the
number of taxpayers subject to the AMT will mushroom, and the swollen AMT
will cancel out a sizeable share of the tax cuts and make the cost of
permanently extending the tax cuts much smaller than it otherwise would
be. This device — proposing to make the tax cuts permanent while
deferring a proposal to continue AMT relief — enables the Administration
to present the cost of making the tax cut permanent as being much lower
than it really is.
There is little
question that AMT relief will be continued beyond 2004. As noted, the
Bush Administration itself intends to propose such relief.[17]
The cost of extending AMT relief beyond 2004 is essentially an "off-book
liability" that must be considered a part of the long-term cost of any
proposal to make the 2001 tax cut permanent.
AMT Relief
E
nd Notes:[1] Congressional Budget Office, “The Budget and Economic Outlook: Fiscal Years 2005 to 2014,”
[2]
Robert E. Rubin,
[3]
The adjustments made here to the CBO baseline projection are the same
adjustments as were made to CBO’s August 2003 baseline in a report
issued jointly in September 2003 by the Committee for Economic
Development, the Concord Coalition, and the Center on Budget and
Policy Priorities. The precise amounts of the adjustments in this
analysis are modestly different from those shown in the September
analysis, because the adjustments shown here reflect the new CBO data
rather than last August’s CBO figures. See “Mid-Term and Long-Term
Deficit Projections,”
[4]
In its presentation of the cost of extending AMT relief in Table 1-3
of its new report, CBO breaks its estimate of the cost of extending
AMT relief into several pieces. First, it shows $376 billion as the
ten-year cost of extending AMT relief. This figure, however, assumes
that all other tax cuts expire as scheduled. Second, in a footnote,
CBO explains that this $376 billion figure increases by $173 billion
if the tax cuts are extended rather than allowed to expire, which is
the assumption used in this analysis. Finally, CBO includes the
interest costs associated with these two pieces. When combined,
these pieces total $658 billion.
[5]
Alice M. Rivlin and Isabel Sawhill, eds., Restoring Fiscal Sanity:
How to Balance the Budget, The Brookings Institution, January
2004. Note that the Brookings book, which was released prior to the
new CBO projections, included a ten-year deficit estimate of $5.3
trillion for the years 2005 – 2014. This figure has been updated to
$5.5 trillion to take into account the new CBO projections.
[6]
See
[7]
In this analysis, we treat the costs of reconstruction in
[8]
Elizabeth Becker and Edmund L. Andrews, “IMF Warns That
[9]
Rubin, et. al., op. cit.
[10]
Robert D. Reischauer, president of the Urban Institute and former
Director of CBO, “Framing the Budget Debate for the Future,”
testimony before the Senate Budget Committee,
[11]
Committee for Economic Development,
[12]
This is as estimated in CBO’s January report, in Table 1-3. Although
Table 1-3 seems to show AMT reform alone costing $469 including
interest, that figure assumes that the 2001 and 2003 tax cuts are
not extended. As CBO notes, extending the tax cuts would push
more taxpayers onto the AMT and make AMT reform more expensive. In
note “c” in Table 1-3, CBO estimates that this “interaction effect”
would add $189 billion to the cost of AMT reform, including interest
costs. Assuming extension of the tax cuts, AMT reform thus would
cost a total of $658 billion, including interest, according to the
CBO estimates.
[13]
CBO, The Long-Term Implications of Current Defense Plans: Summary
Update for Fiscal Year 2004, July 2003; Steven M. Kosiak, “Cost
Growth in Defense Plans, Wars and Occupation of Iraq Could Add Nearly
$700 billion to Decade’s Deficits,” Center for Strategic and
Budgetary Assessments, May 2003. Updated CSBA estimates provided in
December 2003.
[14]
“The President today announced a 9.7 percent increase in
government-wide homeland security funding in his FY 2005 budget…,”
White House Office of the Press Secretary, January 22, 2004.
[15]
[16]
Leonard E. Burman, William G. Gale, and Jeffrey Rohaly, “The AMT:
Projections and Problems,” Tax Notes,
[17]
The temporary AMT relief contained in the 2003 tax-cut legislation
expands a similar provision included in the 2001 tax-cut law, which
itself provided AMT relief only through 2004. The 2001 tax-cut law
provided AMT relief only through 2004 because the cost of providing
permanent AMT relief would have driven the cost of that legislation
well beyond what the fiscal year 2002 Congressional budget resolution
allowed, unless some of the other tax cuts in the 2001 legislation
were pared back. The framers of the 2001 tax cut resorted to the
gimmick of letting AMT relief sunset at the end of 2004, knowing that
Congress would have no choice but to extend AMT relief before it
expired. This same scenario occurred in the 2003 tax-cut
legislation; AMT relief in 2004 was increased so that accelerating
the reduction in income tax rates into 2003 would not cause millions
more filers to become subject to the AMT immediately. Once again,
relief was provided only through 2004, because relief after
2004 could not be squeezed into the Senate’s $350 billion target for
the tax-cut package without scaling back other tax cuts in the
legislation.