
THE FLAWED “POPULATION
PLUS INFLATION” FORMULA
Why TABOR’s Growth Formula Doesn’t Work
By
David H. Bradley, Nicholas Johnson, and Iris J. Lav
|
PDF of
full report
Related Report: |
| If you cannot access the files through the links, right-click on the underlined text, click "Save Link As," download to your directory, and open the document in Adobe Acrobat Reader. |
Limiting the growth of state revenue collections
and state expenditures to a population-growth-plus-inflation formula is a
central provision of a new generation of “tax and expenditure limits” — or
TELs — now being promoted by national anti-government groups. Under such
proposals, state constitutions would be amended to bar state and local
expenditures from rising at a percentage rate that exceeds the rate of
growth of state population plus an inflation factor. A
population-growth-plus-inflation limit is central to
Such formulaic limitations may sound reasonable, but are actually a recipe for sharply reduced public services and an impaired ability to respond effectively to public needs, federal mandates, and changing circumstances.
- If a population-plus-inflation TEL had been in place in all states from 1990 to 2004, aggregate state own-source expenditures in 2004 would have been $162.7 billion, or 21 percent, below its actual level.
- Closing this gap in 2004 could have been achieved by cutting 78 percent of all state K-12 education budgets; all state Medicaid and transportation spending; or 60 percent of all other state spending.
There are a number of reasons that a population plus inflation limit leads to such a dramatic scale-back in government services.
- No existing measure of inflation correctly captures the growth in the cost of the kinds of services purchased in the public sector, so the inflation adjustment generally is not sufficient to allow the continuation of existing services. State governments spend much of their money on education and health care, which typically have cost increases greater than the general rate of inflation. Within the Consumer Price Index (CPI) itself, medical care and education have been growing at twice the rate of the overall CPI.
- The subpopulations that state governments serve tend to grow more rapidly than the overall population growth used in the formula. For example, while total population grew by 15.4 percent from 1990 to 2002, total state prison population grew by 83 percent, disabled children in schools grew by 35 percent, and the number of elderly and disabled persons on Medicaid grew by 70 percent. Over the next 40 years, the elderly population will grow at twice the rate of general population growth.
- The rigidities of formula-based budgeting, such as a population-plus-inflation growth factor, do not allow funding of new priorities that may be embraced by the public, such as reduced class sizes or more stringent corrections policies. They do not allow states to adapt to federal mandates that require states to spend more in areas such as security and education, and they may have no provisions for emergency spending on natural disasters or other unanticipated problems.
|
The “Ratchet Effect”: Increasing the Severity of the Population-plus-Inflation Formula Colorado’s TABOR and many current TEL proposals in other states contain a feature that causes public services to be cut even more than they would under a simple population-growth-plus-inflation formula. This feature is known as the “ratchet effect.” With the ratchet effect, the population growth plus inflation adjustment is applied to the amount of actual expenditures or revenue in the prior year (rather than to the amount of allowable expenditures or revenues). When state budgets grow slowly or fall, as in the recent fiscal crisis, actual spending or revenues are likely to be lower than the level permitted by the formula. If this lower level becomes the new base to which the population growth and inflation adjustment is applied, then the level of public services is permanently ratcheted down. Consider a hypothetical state with $1 billion in revenues in 2001 and with population growth plus inflation equaling 5 percent annually. With no ratchet effect, by 2005 allowable revenue would be $1.22 billion (reflecting four years of 5 percent growth, compounded). But if actual revenue collections declined in the first year by 5 percent, allowable revenue collections in years thereafter would be calculated from that new, lower base. As a result, by 2005, even if the economy and tax base fully recovered, allowable revenues could not exceed $1.1 billion — a very significant difference of 10 percent. The ratchet effect typically is not explicit, but rather hidden within the wording of a TABOR proposal. Any TABOR proposal must be carefully scrutinized to determine whether it contains a ratchet effect. |
- A TEL based on a population-plus-inflation growth factor, or any other artificial formula, moves the budget process away from the careful weighing of competing priorities and consideration of the value of new initiatives and toward a process defined by sterile limits that require the shrinking of government services in most years.
|
Population Growth Plus Inflation in Colorado The population-growth-plus-inflation formula is a key reason why Colorado’s TABOR amendment — a 1992 constitutional provision — has caused severe problems for the provision of public services in that state. After 12 years of TABOR, Colorado has among the nation’s poorest-funded — and poorest-performing — public services. For example, Colorado ranks 47th in K-12 education funding as a share of state income. The ratio of teacher salaries to average private-sector earnings is lower in Colorado than any other state. Child immunization rates are also lowest in the nation. More poor children lack health insurance in Colorado than in all but five other states, and three-quarters of Colorado pediatricians won’t treat Medicaid patients because reimbursement rates are so low. High school graduation rates, support for public colleges and universities, and access to prenatal care all have fallen since 1992. Just since 2001, as a result of the formula (combined with the ratchet effect described in the box on the previous page), Colorado policymakers have been forced to make $1 billion in spending cuts. Unlike in other states, TABOR’s limit will not allow those services to be restored; in fiscal year 2006 Colorado is scheduled to refund $459 million to taxpayers while being required to cut an additional $263 million out of its budget. Source: Nicholas Johnson and David Bradley, Public Services and TABOR in Colorado, Center on Budget and Policy Priorities, January 2005 |
The Population-Plus-Inflation Benchmark and the Cost of Government
Central to the strictest TELs, such
as
A casual observer of state finances might believe that such a formula is quite reasonable. After all, this formula not only allows the public sector to maintain its current level of expenditures, but allows for some growth in nominal terms. Nevertheless, a one-size-fits-all population-growth-plus-inflation formula is deeply flawed. Such a formula is likely to hinder the ability of state governments to continue to provide services at their current levels. A state that truly limited growth in its budget to population growth plus inflation would need to cut back or eliminate a range of services in most years.
There are several reasons why states cannot provide a constant level of public services under a population-plus-inflation formula.
- No existing measure of inflation — neither the Consumer Price Index nor the GDP deflator nor any other measure — correctly captures the growth in the cost of the kinds of services purchased in the public sector. State governments, for instance, are major purchasers of health care, the costs of which are rising far faster than the general rate of inflation.
- In most states a rising share of the state population is utilizing public services. For instance, the number of senior citizens in most states is rising faster than the general population, putting new burdens on programs such as Medicaid.[2]
- States often face the burden of providing new or expanded services for reasons outside the control of lawmakers. These include court mandates to increase school funding or other services, response to natural disasters or public health emergencies, major economic shifts such as plant closings, or other reasons.
- In an era of large federal deficits, states are increasingly expected to finance a substantial share of new domestic priorities. Some of these expectations take the form of formal mandates, such as the additional education expenditures required under the No Child Left Behind law. Others may reflect what one analyst has called “underfunded expectations,” such as the expectation that states and local governments will provide heightened levels of security as part of the war on terrorism.
- New public priorities may require new funding from states above and beyond levels of inflation. Recent state initiatives in areas such as K-12 class size reduction, prescription drug coverage for seniors, college scholarships for students with high levels of academic achievement, and other initiatives generally cannot be accommodated under the population-growth-plus-inflation formula.
It is important to note that all state programs — not just those with cost pressures exceeding the population-growth-plus-inflation level — are threatened by a rigid population-growth-plus-inflation limit. This is because such limits typically cover nearly all areas of state and local spending. So, if one spending area is forced to grow faster than the rate allowed under the limit (for instance due to court order, federal mandate or popular demand), then another spending area must grow at a slower pace — which is to say that in terms of the level of service provided, that second spending area must actually shrink.
|
Local Governments and TABOR Most current state TEL proposals would apply the population plus inflation formula to local government budgets as well as to those of the state government. This causes two problems for local governments.
For these reasons, organizations of local governments— which represent elected officials across the political spectrum — have expressed particular concern about such proposals. For instance, the National League of Cities has taken a strong stance against Colorado-style TABOR proposals and the Wisconsin Alliance of Cities has been among the leading voices against a TEL proposal in that state. |
Realistic Budgeting for Public Services
Proponents of TABOR-type tax and expenditure limits sometimes contend that a growth formula based on population plus inflation would be adequate to maintain public services at a roughly constant level. But researchers long have recognized that the services provided in the public sector, such as education, health care, and law enforcement, tend to rise in cost faster than many other goods and services in the economy in general. This analysis was first put forward by economist William Baumol, who pointed out that technology and productivity gains may make goods cheaper to produce, but the services that government provides are different. Baumol said public services typically rely heavily on well-trained professionals — teachers, police officers, doctors and nurses, and so on — and technology gains do not make these services cheaper to provide.[3] It may take far fewer workers to build an automobile than it did 30 years ago, but it still takes one teacher to lead a classroom of children. (In fact, as education has become increasingly important, the trend is toward more teachers per pupil, not fewer.) Doctors generally still see patients one by one, and nursing care remains labor intensive despite technology.
For this and other reasons, “inflation” as
commonly measured does not accurately reflect growth in the costs to
government. The most commonly used measure of inflation and the measure
preferred by those pushing strict tax and expenditure limits is the
“Consumer Price Index-
|
Table 1 |
|||
|
Relative Importance of Major CPI Components, 2003 |
Spending Categories as a Share of Total State Own-Source Expenditures, FY 2003 |
||
|
|
|
|
|
|
Housing |
42.1 |
K-12 Education |
26.1 |
|
Transportation |
16.9 |
Medicaid |
13.1 |
|
Food and Beverages |
15.4 |
Higher Education |
12.9 |
|
Medical Care |
6.1 |
Transportation |
7.4 |
|
Recreation |
5.9 |
Corrections |
4.9 |
|
Apparel |
4.0 |
Public Assistance |
1.5 |
|
Other |
9.7 |
Other |
34.0 |
|
Total |
100 |
Total |
100 |
|
Source: U.S. Bureau of Labor Statistics, http://www.bls.gov/cpi/cpiri2003.pdf; NASBO 2003 State Expenditure Report. “Other” state spending includes the State Children’s Health Insurance Program. |
|||
Because governments purchase services in economic sectors that are less likely to reap efficiency and productivity gains found in other sectors of the economy, they face a different cost structure than urban consumers. Table 2 below compares the change in the CPI-U for all items to components of the CPI-U that are roughly analogous – though not strictly comparable — to the major categories of states’ purchases.[4] While the overall CPI-U increased by 27.3 percent from 1993 to 2003, costs in the three of the largest categories of government spending increased by much more. The basket of goods that governments purchase is heavily weighted with items that have seen significantly greater cost increases in the past decade than the items in the basket of goods that consumers purchase.
Limiting the growth in government spending to
the rate of growth in general inflation will not push down the rate of
growth in the cost of medical care or education. Many factors beyond the
control of any one state are causing the rapid growth in these areas.
Instead, limiting state expenditures will cause a sharp drop in the amount
of medical care and education services a state can support, and reduce its
quality. This is what has happened in
|
Caps Won’t Stop Growth in Health Care Costs When people say state spending is growing “out of control,” they often are referring to the rapid rise in the cost of Medicaid in recent years. But Medicaid is not growing out of control. Medicaid costs are growing at less than half the rate of growth of private health insurance on a per-person basis. Medicaid is also more efficient that private insurance, with lower per-person costs. Growth in Medicaid spending reflects the problem of rising health care costs that is affecting all health insurance, both private and public. The growth in health care costs is largely driven by advances in medical technology. It is a major national policy challenge, and only system-wide approaches to health care costs will address it. Moreover, Medicaid faces two challenges that private insurers do not.
No state can solve these larger problems on its own. Only the federal government can stop the shift in costs from Medicare to Medicaid. And it will require some combination of the federal government and the health care industry to bring down the annual rate of increase in health care costs in the country. Many states already have, however, taken actions to improve the efficiency of their Medicaid programs through promoting disease management, managed care, prescription drug cost containment and similar policies. Beyond that, states have few good options to bring down the rate of growth in Medicaid costs. Policies such as reducing eligibility or imposing cost sharing on families living at the poverty line unfairly shift the burden of a system-wide problem onto the most vulnerable members of society. And such policies are often counterproductive because they increase the ranks of the uninsured. Sick people cost more when they are uninsured — and receiving care in emergency rooms — than when they are covered by Medicaid. |
Just as the general rate of inflation fails to capture actual price changes faced by governments, overall population growth fails to capture changes in the level of need for services. Table 3 provides a comparison of growth factors affecting government costs. While total population grew by a total of 15.4 percent from 1990 to 2002, other areas of state budgets that are the determinants of the need for services and expenditures grew by much larger percentages during this period. For example, Medicaid enrollment of the expensive-to-serve population of elderly, blind, and disabled rose nearly 70 percent from 1990 through 2002.
|
Table 2 |
|
|
Inflation Factor |
Percent Change, 1993-2003 |
|
CPI-U, All Items |
27.3 |
|
CPI-U, Medical Care |
47.5 |
|
CPI-U, Medical Care Services |
50.8 |
|
CPI-U, Prescription Drugs and Medical Supplies |
46.3 |
|
CPI-U, Education |
71.4 |
|
CPI-U, Transportation Services |
32.8 |
|
Source: U.S. Bureau of
Labor Statistics. |
|
In the future, the growth of subpopulations may take on even greater significance in determining the cost of providing state services. In particular, the elderly population will be rising rapidly. According to Census Bureau projections, the share of the population aged 65 and older is projected to rise from 12.4 percent in 2000 to 20.4 percent in 2040. While the total population is projected to increase by 39 percent from 2000 to 2040, the population aged 65 and older is projected to increase by 128 percent during this period. Put another way, while total population growth is expected to increase at an average annual rate of 0.8 percent from 2000 to 2040, the elderly population is projected to increase at a rate more than double that — 1.9 percent.
|
Table 3 |
|
|
Determinants of Budget Costs |
Percent Change, 1990-2002 |
|
Population |
15.4 |
|
State Prison Population |
82.8 |
|
Vehicle Miles Traveled |
33.2 |
|
K-12 Enrollment |
16.3 |
|
Disabled Children in Schools (IDEA) |
34.6 |
|
Medicaid Enrollment – Elderly and Blind/Disabled |
69.6 |
|
Medicaid Enrollment – Children and Adults |
80.8 |
|
Public University Enrollment* |
12.8 |
|
Source: U.S. Bureau of the Census, U.S. Bureau of Justice Statistics, U.S. Federal Highway Administration, National Center for Education Statistics, Centers for Medicare and Medicaid Services. *Data through 2001. |
|
When TABOR proponents argue that spending limitations will not shrink government, they imply that the limits will allow government to continue providing services at current levels. The reality is that spending increases limited to increases in population and general inflation will result in a reduction of service provision over time. For example, if caseload in the average program grows just 1 percent faster than general population and the cost of providing public services on average grows just 1 percent faster than general inflation, within ten years state government would be providing services to 20 percent fewer people than it would without the limit, or would be providing a level or quality of services 20 percent lower.
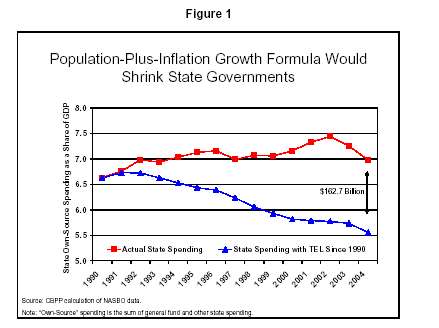
A formula that fails to take into account the cost factors in Tables 2 and 3 would force a state to scale back public services. Figure 1 shows trends in state own-source spending under two scenarios — actual spending and spending limited to the growth of population plus CPI. From 1990 to 2004, total state own-source spending rose slightly, from 6.6 to 7.0 percent of gross domestic product (GDP). If state own-source spending had been limited to changes in population plus inflation over this same time period, total spending would have declined from 6.6 to 5.6 percent of GDP.[6]
|
How Might States Cut $162.7 Billion? If a population-plus-inflation spending limit had been in effect for total state spending since 1990, state spending in 2004 would have been $631 billion rather than the actual figure of $793.7 billion. In other words, states would have had to cut $162.7 billion from their annual budgets. To place that amount in context, $162.7 billion equals:
Source: CBPP calculations from NASBO data. |
If a population-plus-inflation growth formula had been in place in all states from 1990 to 2004, total state own-source expenditure in 2004 would have been $631 billion, which is $162.7 billion, or 21%, less than actual spending in 2004. Public services would have been cut far below their current levels. (See box.)
Mandates
There is another basic flaw with the population-plus-growth formula: It fails to take into account the possibility that court, voter, or federal mandates may require a state to take on new responsibilities. Mandates, whether internal or external, may increase the responsibilities and costs borne by the state without any proactive policy change on the part of state lawmakers. Rigid tax and expenditure limits, such as those based on population change and inflation, inadequately reflect the potential costs that may be imposed on state and local governments.
Court mandates, particularly for
K-12 education funding, in numerous states have increased costs to state
governments in recent years. In the past 35 years, there have been court
challenges to the adequacy and equity of K-12 education funding in 44
states. Courts in
-
The 1990 Kentucky Education Reform Act (KERA) was passed in
response to a state Supreme Court judgment mandating
-
In
Voter mandates and initiatives have also increased costs to the several states, both through funded and unfunded initiatives. Ballot measures often do not have dedicated funding sources or even specific cost estimates. By definition a population-plus-inflation TEL does not provide funds for policy changes, but only for the current service levels. When confronted with new voter demands, policymakers must accommodate voter mandates by squeezing funding for existing programs or by getting voter approval for a tax increase.
- In the 1990s voters in
-
In the past decade, voters in several states, including
- Beyond internal changes, federal pressures — such as increased demands for states to improve homeland security or underfunded education mandates — have driven up costs to state and local governments. Just three underfunded mandates from the federal government — election reform, education of disabled children, and the No Child Left Behind law — are costing states around $73 billion from fiscal year 2002 through fiscal year 2005.
States are also shouldering a larger share of health care costs for low-income people because of the cost shift from Medicare (a federal program) to Medicaid (a joint program in which states bear an average of 43 percent of the costs). States are expected to spend around $28 billion in state and local funds from fiscal year 2002 through fiscal year 2005 to provide prescription drugs to low-income elderly and disabled beneficiaries eligible for Medicare and Medicaid. While the new Medicare law enacted in 2003 will cover under Medicare some of the cost of prescription drugs for all Medicare beneficiaries beginning in 2006, states will not realize substantial savings. The new law includes an unprecedented provision that will require states to reimburse the federal government for most of the cost of prescription drug coverage for individuals who are eligible for Medicaid as well as Medicare.
The interaction between federal unfunded
mandates and underfunded expectations and strict state tax and expenditure
limitations may impede the ability of states to implement their own
citizens’ policy priorities. If states do not exempt all federal mandates
from TEL limitations, any additional cost imposed from the
New Initiatives
State governments need to be able to change with the times. What is considered an adequate level of public services at one point in time may seem inadequate 30 years later. Voters and legislators may adjust their policy preferences to improve or expand government investment and program coverage. In the 1990s, there were a number of examples of such changing policy preferences:
-
Recognizing the positive effects of smaller class sizes on
educational outcomes, a number of states including
-
In recognition of the increasing importance of a well-educated
workforce and the desire to attract and retain college-bound students, a
number of states have implemented or increased merit and need-based
scholarship programs for college students since the 1990s, including
- In the 1990s, nearly every state expanded health care for children in recognition of the high levels of uninsured children and the availability of federal matching dollars. For example, MinnesotaCare was established in 1992 to provide health insurance for low- and moderate-income people who do not otherwise have access to health insurance. The program has grown from an average monthly enrollment of 22,896 in 1992 to 137,936 in 2002, while state funding has risen from $6.9 million in 1992 to $194.6 million in 2002.
|
The Slow Squeeze of a TEL Formula It may be a period of time — years, even decades — before the reductions in public services shown elsewhere in this paper as a consequence of a strict TEL actually result in reduced services — and even longer, perhaps, before a decline in the quality of life becomes apparent. There are several reasons to expect such delayed impacts.
|
Unanticipated Needs
State governments inevitably face spending needs that cannot be anticipated. Natural disasters, public health emergencies, economic changes, and other such occurrences place expensive but unexpected demands on state and local governments. In the last few years, for instance, states have faced:
-
New homeland security requirements. In the wake of the
- Natural disasters. Hurricane-related damages and costs to local governments in Florida from hurricanes Charley, Frances, Ivan, and Jeanne, for example, are estimated at least $2 billion. Despite federal assistance in the wake of natural disasters, state and local governments still shoulder significant costs.
- Economic problems. Unexpected economic dislocation from problems such as plant closings has cost implications for state and local governments. The loss of nearly 3 million manufacturing jobs since the start of the recession in March 2001 has eroded tax revenue and increased the need for public resources.
Conclusion
Formulaic tax and expenditure limits are bad public policy. Tax and spending limits based on population changes and inflation will hinder significantly the ability of state and local governments to cope with unanticipated changes, initiate policy changes, accommodate voter and court mandates, or even maintain current service levels. Evidence in this paper should give policymakers pause before replacing deliberative, legislative budget processes with inflexible, constitutionally-based formulas.
End Notes:
[1] Barry Poulson, “The Next Generation of Tax and Expenditure Limits,” Americans for Prosperity Foundation, May 12, 2004.
[2]
More than two-thirds of Medicaid expenditures are for elderly and
disabled beneficiaries (Kaiser Family Foundation, “
[3] William J. Baumol, 1967. “Macroeconomics of Unbalanced Growth: The Anatomy of Urban Crisis.” American Economic Review 57(2), 415-426.
[4] For example, the education component of the CPI-U is primarily composed of tuition and fixed fees, while government spending on education goes toward teacher salaries, student transportation, computer equipment, etc.
[5]
Nicholas Johnson and David Bradley, Public Services and TABOR in
[6]
Spending data for Figure 1 are from the National Association of State
Budget Officers’ (NASBO) State Expenditure Report, various
years. “State own-source” spending is the sum of general fund and
“other” state spending. This sum was divided by GDP adjusted for the
normal state fiscal year (July-June) to determine state spending as a
percent of GDP. To calculate state spending under a
population-plus-inflation TEL, the previous year’s allowable spending
limit was multiplied by the sum of the percent growth in population plus
inflation. Since the model starts in 1990, actual (not
allowable) spending was used to determine the spending limit in 1991.
Specifically, actual state own-source spending was $375.3 billion in
1990 and the growth in population plus inflation from 1990 to 1991 was
5.6 percent. Thus the estimated 1991 total state spending under a
population-plus-inflation growth formula was $375.3 billion x 1.056, or
$396 billion. The estimated 1992 figure was then calculated by
multiplying $396 billion by the change in population plus inflation from
1991 to 1992. By 2004, actual state own-source spending was $793.7
billion while spending under a TEL growth formula would have been $631
billion — a difference of $162.7 billion. Note that the calculation
does not include a ratchet effect such as the one in
[7] New Jersey Office of Legislative Services, See http://www.njleg.state.nj.us/legislativepub/budget/educ04.pdf.